You can find the prior SPX IC posts in this series at the links below:
- New Iron Condor Series Introduction
- 38 DTE SPX Iron Condor Results Summary
- 38 DTE SPX Iron Condor Results Summary - Part 2
- 45 DTE SPX Iron Condor Results Summary
- 45 DTE SPX Iron Condor Results Summary - Part 2
- 52 DTE SPX Iron Condor Results Summary
Normalized P&L per Day
The P&L per day values shown in the charts below are expressed as a percentage of the max risk for that test run...this is necessary in order to fairly compare the returns of each of the different wing widths (25 point, 50 point, 75 point).
The results:
- We continue to see more variability in P&L per day readings in the 25 point wing ICs, than in the larger wing width ICs
- Again, similar to the prior test runs, as the delta of the short strikes increases, the variability in the P&L per day readings increases
- The largest reading was 0.18%, which is the same as the largest reading for the 38 and 45 DTE ICs. There was one strategy variation with a 0.18% value:
- ST (NA:50), 25 point wings, 16 delta
- The next best readings came in at 0.16% and 0.15% and were associated with five test runs:
- EL (NA:50), 25 point wings, 16 delta (0.16%)
- DN (NA:50), 50 point wings, 16 delta (0.15%)
- ST (NA:50), 25 point wings, 20 delta (0.15%)
- DN (NA:50), 50 point wings, 16 delta (0.15%)
- ST (300:50), 25 point wings, 16 delta (0.15%)
- 20 of the top 22 readings were associated with a profit taking level of 50%
- Of these 20 readings, 14 had short delta strikes of 16

 |
| (click to enlarge) |
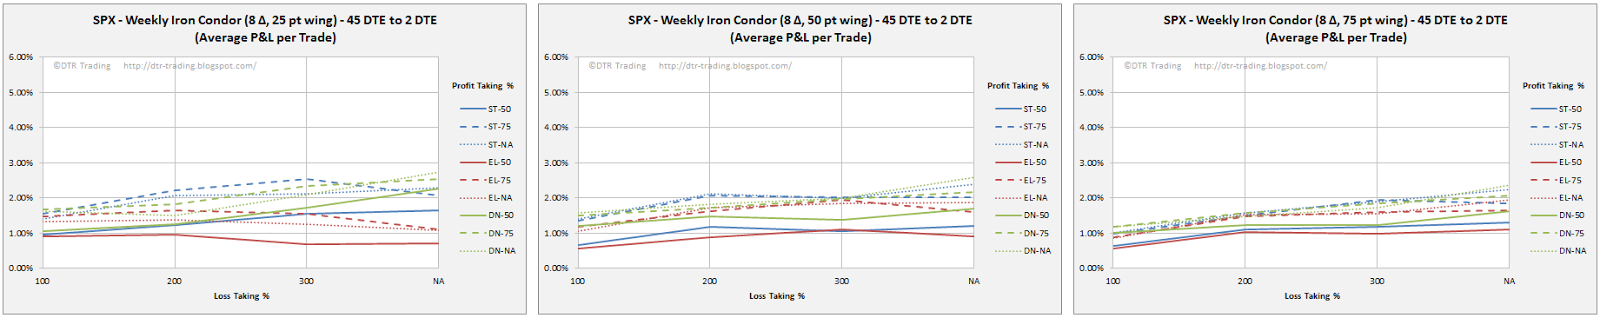
Normalized P&L per Trade
The normalized P&L per trade charts display returns expressed as a percentage of the max risk for a given test run.
The results:
- The variability in normalized P&L per trade again increases as the delta of the short strike increases, and decreases with increasing wing width.
- In general, the returns per trade increase with increasing loss taking %, and this trend is significantly more pronounced than at 52 DTE.
- The largest normalized P&L per trade was 6.0% for two strategy variations:
- ST (NA:75), 25 point wings, 16 delta
- ST (NA:50), 25 point wings, 16 delta
- 22 variations had P&L per trade values of 5.0% or greater
- 21 of these 22 did not use a loss taking exit (loss taking % = NA)
- 14 of these 22 used a short strike delta of 16
- 12 of these 22 were delta neutral (DN) structures (9 were ST structures)
- 12 of these 22 used a profit taking exit of 75% (6 used a profit taking % = NA)
- Wing widths for these 22 spanned all of the possible test values
- The 59 DTE ICs have the largest P&L per trade readings, and largest standard deviations:
- 59 DTE; mean 2.75% / SD 1.20%
- 52 DTE: mean 2.33% / SD 0.88%
- 45 DTE: mean 2.23% / SD 0.87%
- 38 DTE: mean 1.88% / SD 0.75%

 |
| (click to enlarge) |
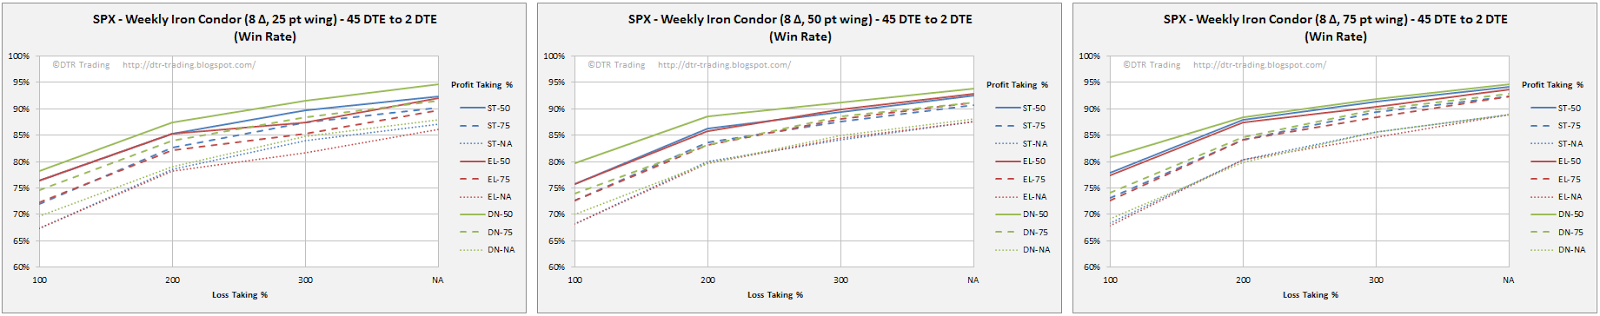
Win Rate
The win rate trends appear fairly consistent across the DTEs tested so far:
- In general, win rates tend to increase as wing widths increase
- Win rates tend to increase as the delta of the short strikes decreases
- The top win rate was 96%, and was associated with three strategies:
- DN (NA:50), wing width 75, 8 delta
- ST (NA:50), wing width 75, 8 delta
- EL (NA:50), wing width 75, 8 delta
- The top 41 strategies all had win rates of 91% or better.
- Of these 41, 28 took profits at 50%
- Of these 41, 35 did not use loss exits (they exited at 2 DTE; loss taking % = NA)
- Of these 41, 26 had short strike deltas of 8
- Wing widths and IC structures varied for these 41
- The strategies with the top win rates also had some of the largest single losses...and this is consistent across the DTEs tested
- The win rates for the 59 DTE ICs were slightly better than the win rates for the 52 DTE ICs

 |
| (click to enlarge) |
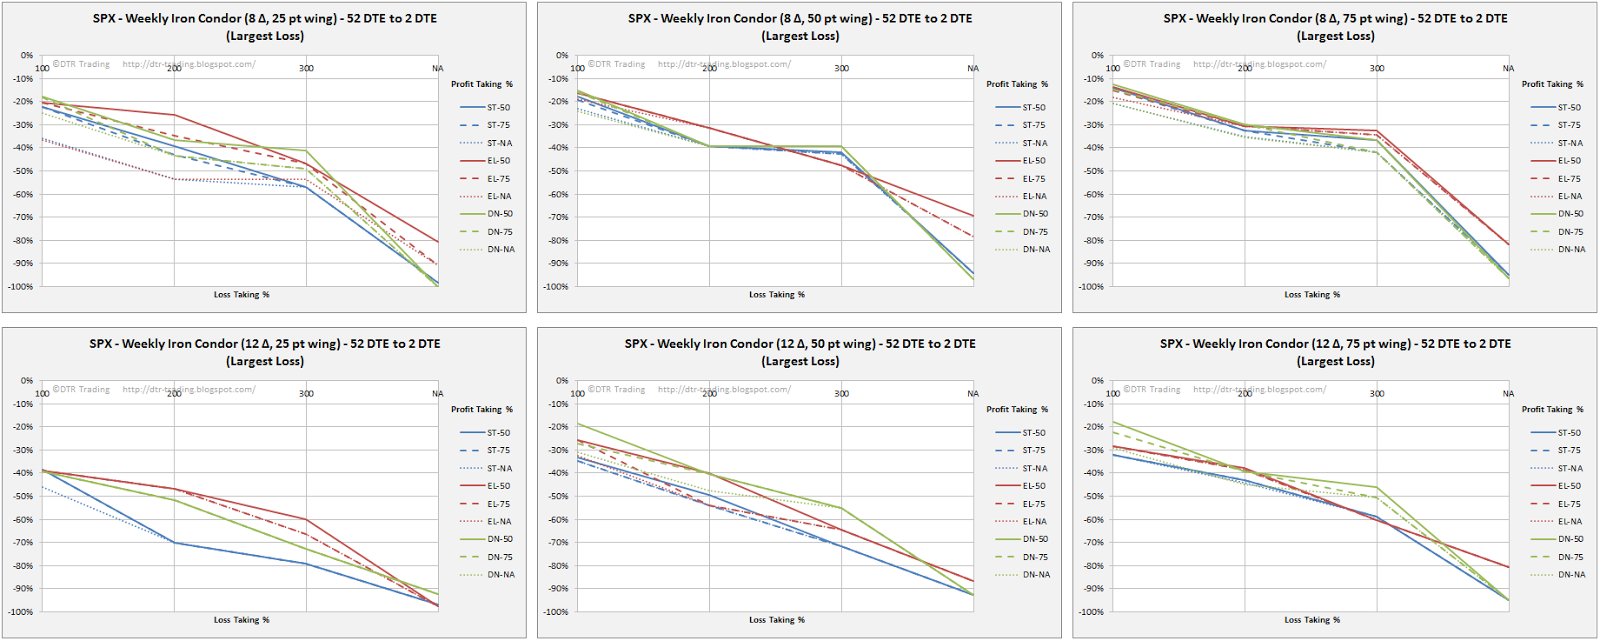
Largest Loss
The next charts show the normalized largest loss for each of the test runs These largest losses are expressed as a percentage of the max risk found in the roughly 200 trades in each test run.
The results:
- Typically, the largest loss percentage increases with increasing loss taking level
- There were a number of variations where the largest loss was over 200% of the max risk. This particular loss was due to bad data, rather than an actual loss of that size.
- In all, there were 27 variations impacted by this bad quote, which was associated with the 14-Nov-2014 expiration. All of these trades should have exited with a max loss close to 100% somewhere between 10-Oct-2014 and 15-Oct-2014.
- By 15-Oct-2014, the market was below the long put of the put spread in these trades...the long put was at 1875 for the 25 point wing strategies. The market low on 15-Oct-2014 was 1820, with a close at 1862.
- 72 strategy variations had largest loss readings of 95% or greater
- 58 had short strike deltas of 20, while the other 14 had short strike deltas of 16
- All wing widths, and structures (ST, DN, EL) were present in these 72 strategy variations
- 27 of the top 28 smallest losses used a loss taking level of 100
- 15 of the top 17 smallest losses had short strike deltas of 8
- The top 3 smallest losses were:
- DN (100:50), 75 point wings, 8 delta -> 14% loss (win rate 82%)
- EL (100:50), 50 point wings, 8 delta -> 17% loss (win rate 80%)
- EL (100:75), 50 point wings, 8 delta ->17% loss (win rate 74%)

 |
| (click to enlarge) |
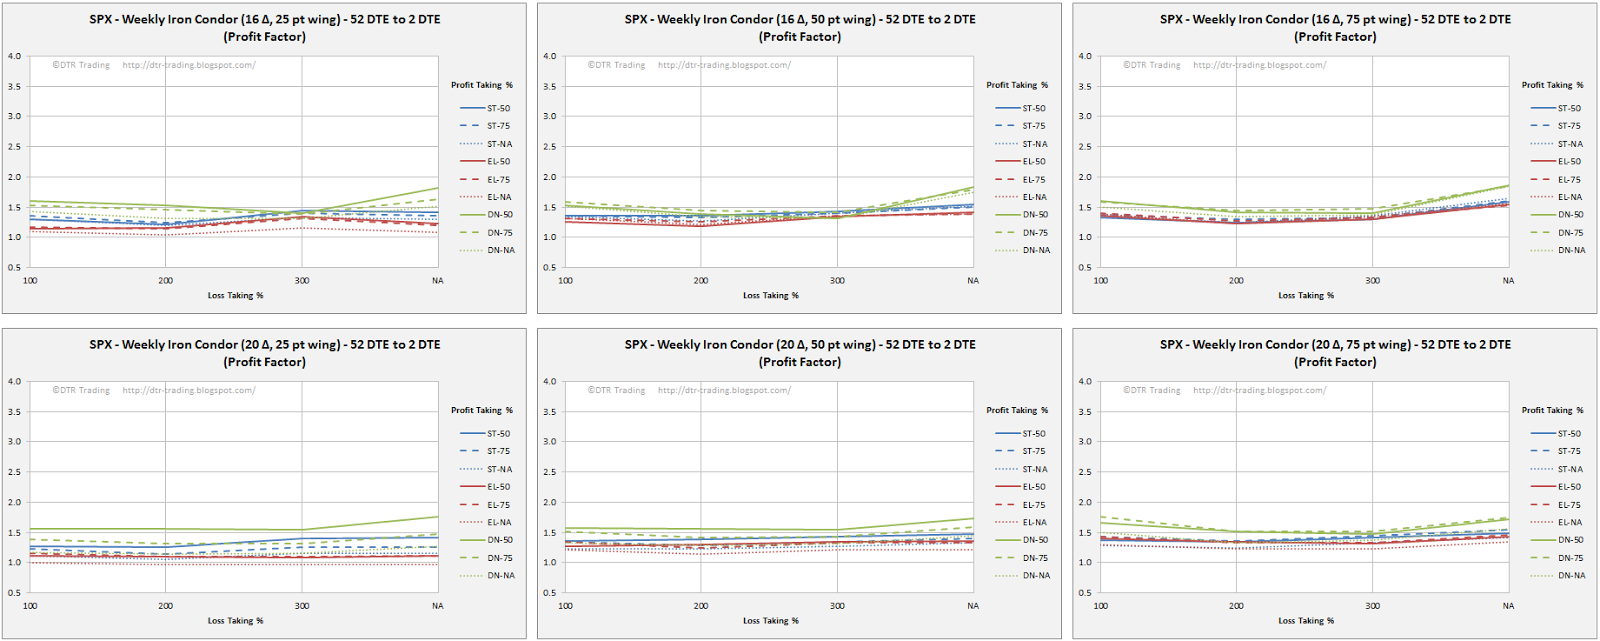
Profit Factor
The profit factor results are listed below:
- Profit factors increase sharply for variations not using a loss taking % (loss taking % = NA)
- 62 strategy variations had profit factors of 2.0 or greater (double the number at 52 DTE!)
- 55 of these 62 did not use a loss taking exit (loss taking % = NA)
- 32 of these 62 used the delta neutral structure (DN)
- 31 of these 62 had short strike deltas of 8
- The top tree performers were:
- DN (NA:NA), 75 point wings, 8 delta -> profit factor of 3.5 (win rate 92%)
- DN (NA:NA), 50 point wings, 8 delta -> profit factor of 3.5 (win rate 90%)
- DN (NA:75), 50 point wings, 8 delta -> profit factor of 3.4 (win rate 92%)
- These top performers had largest losses of approximately -90% due to not implementing loss taking exits

 |
| (click to enlarge) |
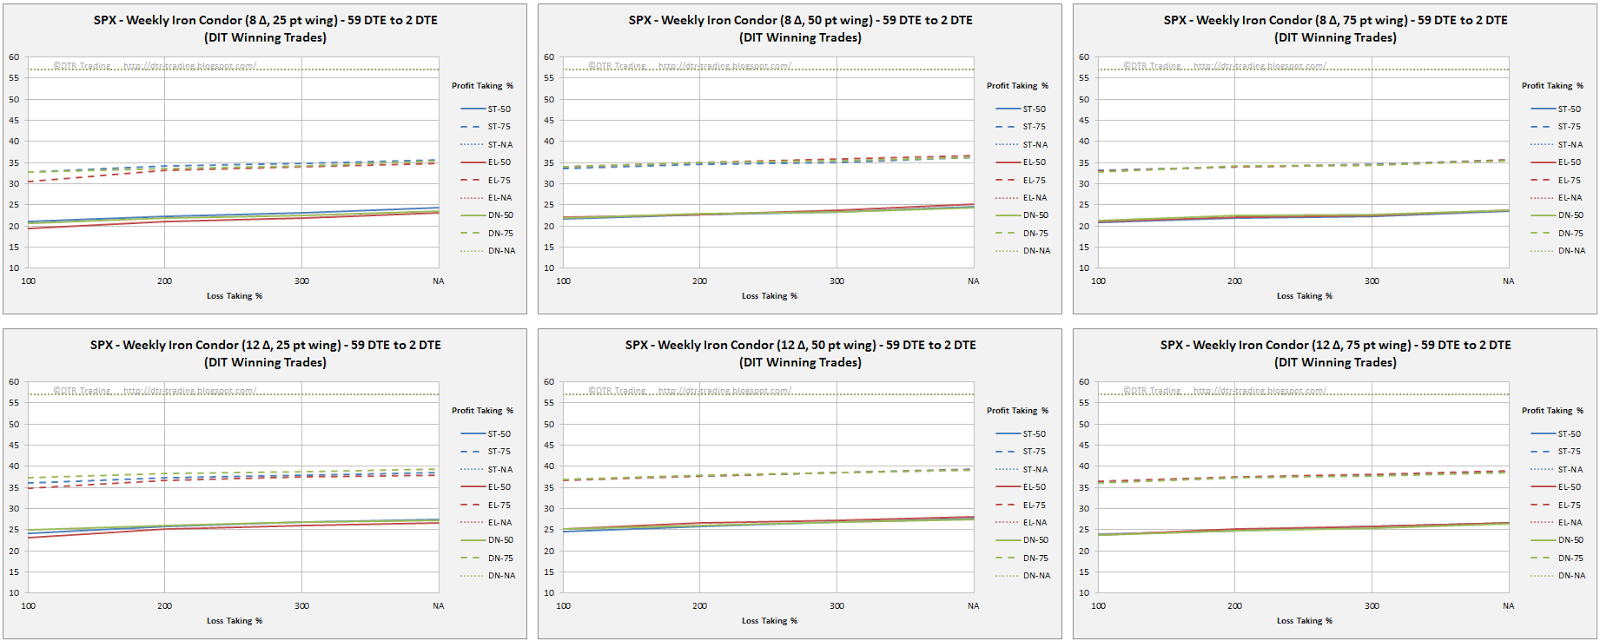
Average DIT For Winning Trades
This metric was derived by averaging all of the DIT for all of the winning trades in a test run. Adding a DIT exit to your profit and loss exits is worth considering.
The trends associated with this metric are consistent with the prior DTE test runs:
- As short strike deltas increase, trade duration increases
- As profit taking level increases, trade duration increases
- The 50% profit taking level should have you out of your trade between 19 and 34 days for a 59 DTE IC, depending on short strike delta
- The smallest winning trade DIT of 19 was associated with 8 delta short strikes, 25 point wings, profit taking at 50%, loss taking at 100%, and the EL structure. The same configuration but using either the ST or DN structures yielded a an average DIT for winning trades of 21
- These were the same trade structures that had the smallest winning trade DIT at 52 DTE
 |
| (click to enlarge) |
Follow my blog by email, RSS feed or Twitter (@DTRTrading). All options are available on the top of the right hand navigation column under the headings "Subscribe To RSS Feed", "Follow By Email", and "Twitter".