CustomMenu

Showing posts with label Straddle. Show all posts

Monday, May 27, 2019

SPX Straddle - 2019 Q1 Review

We looked at the performance of a few of the better performing SPX straddles in a prior article (here). In this post, we'll revisit those straddle variations and see how they performed in the first quarter of this year. Their performance will be compared to their historical performance from January 2007 through December 2018.

These are the variations we will review:
  1. 59 DTE - (25:10) / 2 DTE - exit if the trade has a loss of 25% of its initial credit OR if the trade has a profit of 10% of its initial credit OR at 2 DTE.
  2. 59 DTE - (25:10) / 41 DTE - exit if the trade has a loss of 25% of its initial credit OR if the trade has a profit of 10% of its initial credit OR at 41 DTE.
  3. 59 DTE - (50:25) / 2 DTE - exit if the trade has a loss of 50% of its initial credit OR if the trade has a profit of 25% of its initial credit OR at 2 DTE.
  4. 59 DTE - (50:25) / 24 DTE - exit if the trade has a loss of 50% of its initial credit OR if the trade has a profit of 25% of its initial credit OR at 24 DTE.
  5. 45 DTE - (150:25) / 2 DTE - exit if the trade has a loss of 150% of its initial credit OR if the trade has a profit of 25% of its initial credit OR at 2 DTE.
  6. 45 DTE - (150:25) / 31 DTE - exit if the trade has a loss of 150% of its initial credit OR if the trade has a profit of 25% of its initial credit OR at 31 DTE.

The 45 DTE variations follow the entry and exit criteria popularized by TastyTrade here:

For each variation, I show one table and two charts. The table shows the percent return on portfolio margin. The first chart shows these same return numbers, but compared to their historical returns (max, min, average, and quartiles).The second chart shows the DIT numbers for each variation compared to the average for this variation.

Let's get right to the results for each of these variations.


59 DTE - (25:10) / 2 DTE

The average monthly return for Q1 was -21%, versus the 2007 to 2018 monthly average of +2%. Total return for the quarter was -62%. Pretty bad return numbers. The average DIT for Q1 was 14, which was below the 2007 to 2018 average of 16 DIT.

(click to enlarge)

(click to enlarge)

(click to enlarge)


59 DTE - (25:10) / 41 DTE

The average monthly return for Q1 was -13%, versus the 2007 to 2018 monthly average of +1%. Total return for the quarter was -38%. Again, pretty bad return numbers. The average DIT for Q1 was 10, which was below the 2007 to 2018 average of 12 DIT.

(click to enlarge)

(click to enlarge)

(click to enlarge)


59 DTE - (50:25) / 2 DTE

The average monthly return for Q1 was -34%, versus the 2007 to 2018 monthly average of +4%. Total return for the quarter was -101%. Bad return numbers again. The average DIT for Q1 was 33, which was below the 2007 to 2018 average of 34 DIT.

(click to enlarge)

(click to enlarge)

(click to enlarge)


59 DTE - (50:25) / 24 DTE

The average monthly return for Q1 was -30%, versus the 2007 to 2018 monthly average of +4%. Total return for the quarter was -89%. The bad return numbers continue! The average DIT for Q1 was 30, which was above the 2007 to 2018 average of 29 DIT.

(click to enlarge)

(click to enlarge)

(click to enlarge)


45 DTE - (150:25) / 2 DTE

The average monthly return for Q1 was -78%, versus the 2007 to 2018 monthly average of +2%. Total return for the quarter was -234%! Horrible return numbers for the quarter! The average DIT for Q1 was 35, which was above the 2007 to 2018 average of 28 DIT.

(click to enlarge)

(click to enlarge)

(click to enlarge)


45 DTE - (150:25) / 31 DTE

The average monthly return for Q1 was -11%, versus the 2007 to 2018 monthly average of +1%. Total return for the quarter was -33%. Pretty lousy returns for the Q1. The average DIT for Q1 was 14, which was the same as the 2007 to 2018 average DIT.

(click to enlarge)

(click to enlarge)

(click to enlarge)

All of the straddle variations had negative returns for the quarter. In the next post, we'll review the Q1 returns for the SPX Iron Condor variations.


If you don't want to miss my new blog posts, follow my blog either by email, RSS feed or by Twitter.  All options are free, and are available on the top of the right hand navigation column under the headings "Subscribe To RSS Feed", "Follow By Email", and "Twitter".  I follow blogs by RSS using Feedly, but any RSS reader will work.

Monday, May 6, 2019

SPX Straddle - 2018 Review

In this post we'll look at how the SPX straddle has been performing since I last analyzed its results back in 2015 (here). For this article, we'll just look at the following variations and how they performed from January 2007 through December 2018:

  1. 59 DTE - (25:10) / 2 DTE - exit if the trade has a loss of 25% of its initial credit OR if the trade has a profit of 10% of its initial credit OR at 2 DTE.
  2. 59 DTE - (25:10) / 41 DTE - exit if the trade has a loss of 25% of its initial credit OR if the trade has a profit of 10% of its initial credit OR at 41 DTE.
  3. 59 DTE - (50:25) / 2 DTE - exit if the trade has a loss of 50% of its initial credit OR if the trade has a profit of 25% of its initial credit OR at 2 DTE.
  4. 59 DTE - (50:25) / 24 DTE - exit if the trade has a loss of 50% of its initial credit OR if the trade has a profit of 25% of its initial credit OR at 24 DTE.
  5. 45 DTE - (150:25) / 2 DTE - exit if the trade has a loss of 150% of its initial credit OR if the trade has a profit of 25% of its initial credit OR at 2 DTE.
  6. 45 DTE - (150:25) / 31 DTE - exit if the trade has a loss of 150% of its initial credit OR if the trade has a profit of 25% of its initial credit OR at 31 DTE.

For these backtests, I used the Portfolio Margin (PM) requirements for straddles from TD/ThinkOrSwim from 13-Apr-2019. These numbers were $24K for 59 DTE straddles, and $25.5K for 45 DTE straddles. The performance of these variations in 2015 is shown in the tables below.

(click to enlarge)

(click to enlarge)

Now let's look at the metrics again, but adding in the results through December 2018. The tables below show the same metrics, but highlight which metrics have increased, which metrics have decreased, and which metric are unchanged.

(click to enlarge)

(click to enlarge)

The return metrics (top table) are a mixed bag across all variations. The 59 DTE - 25:10 variations showed performance improvements, the 59 DTE - 50:25 variations were flat/down, and the 45 DTE show performance deterioration. The 59 DTE - 25:10 variation also had improved metrics in the second table.

The corresponding equity curves for these variations are shown in the chart below, along with the chart of the SPX during this same time period.

(click to enlarge)

(click to enlarge)

In case you're interested, I've included the updated return percentages for each variation below.

(average return per year: 21.8%)

(average return per year: 15.6%)

(average return per year: 47.5%)

(average return per year: 45.4%)

(average return per year: 28.1%)

(average return per year: 14.1%)

2018 had some of the lowest returns for these straddles, with all the returns lower than their average annual returns.


If you don't want to miss my new blog posts, follow my blog either by email, RSS feed or by Twitter.  All options are free, and are available on the top of the right hand navigation column under the headings "Subscribe To RSS Feed", "Follow By Email", and "Twitter".  I follow blogs by RSS using Feedly, but any RSS reader will work.

Wednesday, February 3, 2016

SPX Straddle - Normalized Return Charts

The last article on RUT straddles (here) was very popular, so I thought I'd write a similar post on SPX straddles.  Recall that from September, 2015 through November, 2015 I reviewed the backtest results form 28,840 short options straddles on the S&P 500 Index (SPX).  You can read the summary articles from that SPX series here and here, and the introductory article for the straddle series here.

In this post, I am going to show the P&L results for the SPX straddle in line-chart form similar to the last article.  The data in the charts below is only for the non-IVR filtered trades.  The first set of charts shows the P&L Per Day amounts, with each chart representing the results for trades started at the same days-to-expiration (DTE).  Here are a few key points for each chart:
  • Each colored line in a chart represents a particular profit taking percentage level in terms of the credit received
  • The X-axis displays the loss taking percentage level in terms of the credit received
  • The Y-axis displays the average normalized percent P&L per day
  • The Y-axis scale is the same for all the P&L per day charts in this article

It's important to note that these returns are the average normalized returns per day.  This is important when comparing options strategies for the following reasons:
  • Each data point in each of the seven P&L per day charts had different average trade durations.  One data point may have had an average of 15 days-in-trade (DIT), while another may have had an average of 60 DIT.  With most of these strategy variations, there were approximately 100 trades entered for each data point in the charts below.  100 times 15 is 1500 total DIT for a strategy, while 100 times 60 yields a total of 6000 DIT.  The number of DIT obviously impacts the average P&L per day.
  • When a straddle is entered at 38 DTE its initial portfolio margin (PM) requirement is going to be greater than say a straddle entered at 80 DTE.  The difference in margin requirement can be nearly 20% greater in this example.  This initial PM number must be taken into account in order to fairly compare P&L per day values...and has been in the charts below.  Using dollar amounts instead of average normalized P&L per day would not necessarily take into account the different margin requirements for the different DTE variations.

Now, on to the charts...

38 DTE
38 DTE SPX Short Straddle Summary Normalized Percent P&L Per Day Graph
(click to enlarge)
Unlike the 38 DTE RUT straddles, the 38 DTE SPX straddles have a larger range in P&L per day numbers.  There is a greater distance between each of the profit taking lines in the chart above, rather than the overlapping of the same lines for the RUT chart.  Similar to the RUT, if you want to maximize your P&L per day, you should take profits at 10% and losses at 25%.  These readings drop off as you increase your loss levels from 25%, to 50%, to 75%...there is a rebound in P&L per days readings at the two loss levels greater than 75%.  Also note that most of the P&L per day readings on the 38 DTE SPX straddle are greater than the corresponding readings on the 38 DTE RUT straddle.

45 DTE
45 DTE SPX Short Straddle Summary Normalized Percent P&L Per Day Graph
(click to enlarge)
For the 45 DTE SPX straddle, the returns per day are maximized at the 125% and 150% loss taking levels.  The 25% profit taking level had the greatest returns followed by the 35% profit taking level.  Recall that for the 45 DTE RUT straddle, the top performer was the 10% profit taking level, with losses taken at 75%.

52 DTE
52 DTE SPX Short Straddle Summary Normalized Percent P&L Per Day Graph
(click to enlarge)
At 52 DTE, the P&L per day readings are fairly consistent for each of the profit taking levels...with a slight downward slope as the loss taking levels are increased.  Taking losses larger than 25% doesn't pay off at 52 DTE.  At the 25% loss taking level, P&L per day readings were maximized at the 45% profit taking level...although the 35% and 25% profit taking levels were not far behind.  The 45% profit taking level was the clear winner for the 52 DTE RUT straddles as well...with the 25% loss taking level also being the clear winner for the RUT.

59 DTE
59 DTE SPX Short Straddle Summary Normalized Percent P&L Per Day Graph
(click to enlarge)
At 59 DTE, the SPX straddle profit taking lines look very similar to those for the RUT straddle...with P&L per day levels maximized with loss taking at 75%.  To maximize your P&L per day at 59 DTE, take profits at 25% and losses at 75% for both the RUT and SPX straddles.  Your returns per day drop after the 75% loss taking level, so no reason to let your losses get any larger than 75% for the 59 DTE straddle.

66 DTE
66 DTE SPX Short Straddle Summary Normalized Percent P&L Per Day Graph
(click to enlarge)
There's no reason to let your losses get any larger than 25% for the 66 DTE SPX straddle.  Additionally, most of the profit taking lines are bunched together at the 25% loss taking level, so a lower profit taking % is appropriate.  Taking profits at 25% and losses at 25% makes the most sense for the 66 DTE SPX straddle.  The 66 DTE RUT straddle on the other hand had clear performance peaks at the 75% loss level.

73 DTE
73 DTE SPX Short Straddle Summary Normalized Percent P&L Per Day Graph
(click to enlarge)
At 73 DTE, taking losses at 75% has a clear benefit for most of the profit taking levels, except for the 10% profit taking level.  The 35% and 45% profit taking levels were the winners with the loss taking at 75%.  If you're taking losses at 25%, then the 10% profit taking level is superior.  The 73 DTE RUT and SPX straddles both had the profit taking level of 10% showing the strongest performance at the 25% loss level.  Considering both DIT and win rate, I would be inclined to trade the 73 DTE variation with profit taking at 10% and loss taking at 25%.


80 DTE
80 DTE SPX Short Straddle Summary Normalized Percent P&L Per Day Graph
(click to enlarge)
The 10% profit taking level outperformed the other profit taking levels at the 25% and 50% loss levels.  The strongest overall performer was profit taking at 45% with a loss level of 100%.

----

The next set of charts contains the average normalized P&L per trade for the seven different DTE reviewed in my SPX straddle backtest series.  The different initial PM requirements were used when calculating the P&L per trade numbers similar to how the PM was used in calculating the P&L per day numbers.  Also, as above, the next seven charts use the same Y-axis scale.

38 DTE
38 DTE SPX Short Straddle Summary Normalized Percent P&L Per Trade Graph
(click to enlarge)
At 38 DTE, the P&L per trade lines were fairly flat across loss taking levels, so not a huge benefit in carrying trades beyond the 25% loss taking level.  The top performer took profits at 35% and losses at 25%.  For a given profit taking level, the lowest per trade returns seemed to coincide with the 75% loss taking level.

45 DTE
45 DTE SPX Short Straddle Summary Normalized Percent P&L Per Trade Graph
(click to enlarge)
At 45 DTE, per trade returns were maximized at the 125% loss taking level, regardless of the profit taking level.  The top performer took profits at 35% and losses at 125%.  The 25% profit taking level was a close second.  We did not see this pattern on the 45 DTE RUT straddle.

52 DTE
52 DTE SPX Short Straddle Summary Normalized Percent P&L Per Trade Graph
(click to enlarge)
There is a strong similarity between the RUT and SPX straddle charts at 52 DTE.  With both, the 45% profit taking line had the greatest returns per trade.  For the RUT, you should limit your largest loss to 50%, while with the SPX the limit should be at the 75% loss level.

59 DTE
59 DTE SPX Short Straddle Summary Normalized Percent P&L Per Trade Graph
(click to enlarge)
At 59 DTE, P&L per trade was maximized at the 75% loss taking level.  The greatest returns again occurred with the 45% profit taking level, with the highest per trade return being just under 30%.  The RUT and SPX straddle charts look very similar at 59 DTE.

66 DTE
66 DTE SPX Short Straddle Summary Normalized Percent P&L Per Trade Graph
(click to enlarge)
At 66 DTE, you can detect a slight upward drift in most of the profit taking lines in the chart.  There is a clear transition at the 75% loss taking level, but it is hard to ignore the solid returns at the 25% loss taking level.

73 DTE
73 DTE SPX Short Straddle Summary Normalized Percent P&L Per Trade Graph
(click to enlarge)
At 73 DTE, there is a huge increase in P&L per trade by letting losses run to 75%...but no real benefit in letting your losses exceed this amount.  The top performer took profits at 45% and losses at 125%...although the 125% loss level did not deliver returns that much greater than the 75% loss taking level.

80 DTE
80 DTE SPX Short Straddle Summary Normalized Percent P&L Per Trade Graph
(click to enlarge)
At 80 DTE, the P&L per trade was maximized at the 100% loss taking level for all of the profit taking lines except for the 10% profit taking line.  The 10% profit taking level showed maximum per trade returns at the 50% loss taking level, although the returns at the 50% loss taking level are not much greater than at the 25% loss taking level.

For most of the charts, the 10% profit taking level and the 25% loss taking level almost always yielded a return of approximately 5% on the PM requirement...and the PM requirement becomes smaller as we move out in DTE.  We noticed this same pattern with the RUT straddles.  Additionally, at 73 DTE and 80 DTE the 10% profit taking level and 25% loss taking level yielded returns of approximately 10% per trade.

As we noted for the RUT straddles, 5% at 38 DTE is going to be a greater dollar amount than 5% at 80 DTE.  I continue to think that the data around the 10% profit taking level is very interesting.

When we consider profit taking targets we need to consider how these targets impact DIT.  Here are a few approximations that seem to hold with both the SPX and RUT straddles:
  • The 10% profit taking level will have your DIT at approximately 30% of DTE
  • The 25% profit taking level will have your DIT at approximately 60% of DTE
  • The 35% profit taking level will have your DIT at approximately 70% of DTE
  • The 45% profit taking level will have your DIT at approximately 80% of DTE

Don't forget, that as the profit taking level is increased, the win rate drops.  See my SPX Straddle Summary Page for links to all of the articles in the series.  Lastly, over the next several days I will tweet (@DTRTrading) win rate line-charts and DIT line-charts, similar to those above.


Follow my blog by email, RSS feed or Twitter (@DTRTrading).  All options are available on the top of the right hand navigation column under the headings "Subscribe To RSS Feed", "Follow By Email", and "Twitter"

Tuesday, January 26, 2016

RUT Straddle - Normalized Return Charts

In the last two articles (here and here), we reviewed the backtest results of 28,840 short options straddles on the Russell 2000 Index (RUT).  If you haven't read the last two articles, you may want to first read the introductory article for this series Option Straddle Series - P&L Exits.

In this post, I am going to show the P&L results in line-chart form rather than the heat map tables I used in the last articles.  The data in the charts below is only for the non-IVR filtered trades.  The first set of charts shows the P&L Per Day amounts, with each chart representing the results for trades started at the same days to expiration (DTE).  Here are a few key points for each chart:
  • Each colored line in a chart represents a particular profit taking percentage level in terms of the credit received
  • The X-axis displays the loss taking percentage level in terms of the credit received
  • The Y-axis displays the average normalized percent P&L per day
  • The Y-axis scale is the same for all the P&L per day charts in this article

Before we go further, I want to reiterate that these returns are the average normalized returns per day.  What does this mean?  Here are a few points to consider, and that I considered, when calculating these P&L numbers:
  • Each data point in each of the seven P&L per day charts had different average trade durations.  One data point may have had an average of 15 DIT, while another may have had an average of 60 DIT.  With most of these strategy variations, there were approximately 100 trades entered for each data point in the charts below.  100 times 15 is 1500 total DIT for a strategy, while 100 times 60 yields a total of 6000 DIT.  The number of DIT obviously impacts the average P&L per day.
  • When a straddle is entered at 38 DTE its initial portfolio margin (PM) requirement is going to be greater than say a straddle entered at 80 DTE.  The difference in margin requirement can be nearly 20% greater in this example.  This initial PM number must be taken into account in order to fairly compare P&L per day values...and has been in the charts below.  Using dollar amounts instead of average normalized P&L per day would not necessarily take into account the different margin requirements for the different DTE variations.

With that background information finished, let's dive into the charts...

38 DTE
38 DTE RUT Short Straddle Summary Normalized Percent P&L Per Day Graph
(click to enlarge)
A couple of patterns stand out here.  The first is that if you want to maximize your P&L per day at 38 DTE, you should take your profits at 10% and losses at 25%...diminishing returns after that loss level.  That loss level also seems to be the best for the other profit taking levels at 38 DTE.

45 DTE
45 DTE RUT Short Straddle Summary Normalized Percent P&L Per Day Graph
(click to enlarge)
At 45 DTE, you can maximize your P&L per day by sticking with the 10% profit taking level.  The P&L per day numbers increase as we increase our loss taking level from 25%, to 50%, to 75%, with a peak clearly present at 75%.  Taking larger losses than 75% doesn't make sense at 45 DTE.

52 DTE
52 DTE RUT Short Straddle Summary Normalized Percent P&L Per Day Graph
(click to enlarge)
At 52 DTE, it doesn't make much sense taking a loss greater than 50%, and a case could be made to stick with a loss level of 25% to maximize your P&L per day for several variations.  The 45% profit taking level was the top performer at 52 DTE.  The 10% profit taking level wasn't far behind when taking losses at 25% of the credit received.
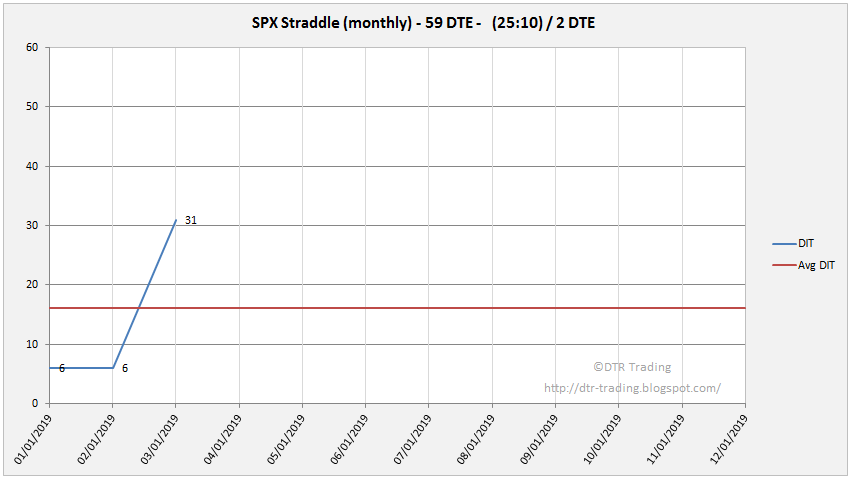
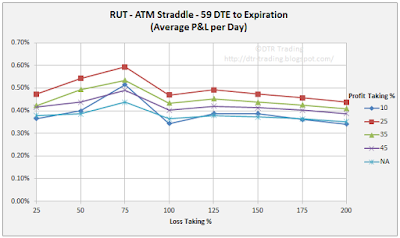
59 DTE
59 DTE RUT Short Straddle Summary Normalized Percent P&L Per Day Graph
(click to enlarge)
At 59 DTE, the 10% profit taking level really slips behind, with the 25% and 35% profit taking levels showing the greatest P&L per day readings.  The loss taking levels show a clear pattern here...as losses are increased from 25%, to 50%, to 75%, P&L per day readings increase for all of the profit taking levels.  At 59 DTE, don't set your loss threshold greater than 75%...your P&L per day numbers drop off rapidly after this loss level.

66 DTE
66 DTE RUT Short Straddle Summary Normalized Percent P&L Per Day Graph
(click to enlarge)
At 66 DTE, the 50% loss taking level has only slightly lower P&L per day readings than the 75% loss taking level for the four top performers.  There is a clear trend of increasing P&L per day readings as the loss levels are increase from 25%, to 50%, to 75%.  At 66 DTE, the top profit taking levels are 35% and 45%.  As with the 59 DTE variations, don't set your loss level greater than 75% for the 66 DTE variations.

73 DTE
73 DTE RUT Short Straddle Summary Normalized Percent P&L Per Day Graph
(click to enlarge)
At 73 DTE, we can maximize our P&L per day by using a 10% profit taking level and a 50% loss taking level.  The maximum P&L per day value for the 25% profit taking level also occurs with a 50% loss taking level.  The other profit taking variation all see a maximum P&L per day value at the 75% loss taking level.

80 DTE
80 DTE RUT Short Straddle Summary Normalized Percent P&L Per Day Graph
(click to enlarge)
At 80 DTE the P&L per day readings for a given profit taking level do not change too much with different loss taking levels...the lines are fairly flat...except for the 10% profit taking line.  For the 80 DTE variations, you might want to set your loss level at 25%, since it seems that there is not much of an increase in P&L per day if you let your losses expand beyond this point.  At 80 DTE, the 25% profit taking level was the top performer.

----

The next set of charts contains the average normalized P&L per trade for the seven different DTE reviewed in my RUT straddle backtest series.  The different initial PM requirements were used when calculating the P&L per trade numbers similar to how the PM was used in calculating the P&L per day numbers.  Also, as above, the next seven charts use the same Y-axis scale...now to the charts.

38 DTE
38 DTE RUT Short Straddle Summary Normalized Percent P&L Per Trade Graph
(click to enlarge)
The greatest P&L per trade numbers were associated with the variations that carried trades to expiration (NA) rather than using a profit taking target.  The greatest P&L per trade value for the 10% profit taking variations occurred at the 25% loss level.  The other variations had their greatest P&L per trade values at the 100% loss level.

45 DTE
45 DTE RUT Short Straddle Summary Normalized Percent P&L Per Trade Graph
(click to enlarge)
If you choose to trade at 45 DTE, the magic loss taking level is 75%...taking a greater loss than this does not increase your P&L per trade.

52 DTE
52 DTE RUT Short Straddle Summary Normalized Percent P&L Per Trade Graph
(click to enlarge)
At 52 DTE, you pretty much hit your max P&L per trade numbers at the 50% loss taking level.  P&L per trade increases as you increase the profit taking percentage from 10% to expiration (NA).
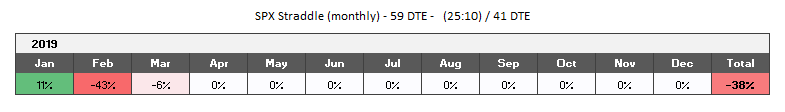
59 DTE
59 DTE RUT Short Straddle Summary Normalized Percent P&L Per Trade Graph
(click to enlarge)
At 59 DTE, there is a clear trend of increasing P&L per trade as you increase the loss taking level from 25%, to 50%, to 75%...with a drop in P&L per trade as you increase the loss taking level above this point.

66 DTE
66 DTE RUT Short Straddle Summary Normalized Percent P&L Per Trade Graph
(click to enlarge)
P&L per trade numbers are still greater at 66 DTE than at shorter DTE levels.  At 66 DTE, profit taking at 45% showed the highest returns.  We continue to see the trend of increasing P&L per trade as the loss taking levels are increased up to 75%.  No reason to use a loss level of greater than 75%, since there are lower per trade returns after this point.

73 DTE
73 DTE RUT Short Straddle Summary Normalized Percent P&L Per Trade Graph
(click to enlarge)
At 73 DTE, the loss taking levels of NA, 45%, and 35% are clustered together, and reach a maximum P&L per trade at the 75% loss taking level.  For the 25% and 10% profit taking levels, the maximum P&L per trade values occur at the 50% loss taking level.

80 DTE
80 DTE RUT Short Straddle Summary Normalized Percent P&L Per Trade Graph
(click to enlarge)
Up until this point, P&L per trade has been increasing with DTE.  But at 80 DTE, the maximum returns per trade are lower for profit taking levels above 10%.  Also, at 80 DTE we do not see the peak returns occur at the 75% loss taking level...the returns per trade continue increasing all the way to the 150% loss taking level...except for the 10% profit taking level.  The 10% profit taking level showed maximum per trade returns at the 50% loss taking level at both 73 DTE and 80 DTE.

For most of the charts, the 10 percent profit taking level and the 25% loss almost always yielded a return of 5% on the PM requirement...and the PM requirement becomes smaller as we move out in DTE.  So, 5% at 38 DTE is going to be a greater dollar amount than 5% at 80 DTE.  I thought the data around the 10% profit taking level was interesting.

When we are actually trading these straddles, not just analyzing the data, we need to consider effective capital utilization.  Let's look at a quick example:
  • Profit taking at the 10 % level will generally have your DIT at about 30% of DTE.  So, for a 38 DTE trade we can expect to be in the trade for approximately 11 days, while an 80 DTE trade would last approximately 24 days to hit the same 10% profit taking level.
  • For the 10% profit taking level, using a 25% loss target, will yield approximately a 5% return on PM at both 38 DTE and 80 DTE...but the 5% number will be a larger dollar value at 38 DTE than at 80 DTE.
  • This is a slightly contrived example, but it illustrates how to consider applying the data in my blog posts to your trading.

When we consider profit taking targets we need to consider how these targets impact DIT.  Here are a few approximations that seem to hold with RUT straddles:
  • The 10% profit taking level will have your DIT at approximately 30% of DTE
  • The 25% profit taking level will have your DIT at approximately 60% of DTE
  • The 35% profit taking level will have your DIT at approximately 70% of DTE
  • The 45% profit taking level will have your DIT at approximately 80% of DTE

Don't forget, that as the profit taking level is increased, the win rate drops.  See my RUT Straddle Summary Page for links to all of the articles in the series.  Lastly, over the next several days I will tweet (@DTRTrading) win rate line-charts and DIT line-charts, similar to those above.


Follow my blog by email, RSS feed or Twitter (@DTRTrading).  All options are available on the top of the right hand navigation column under the headings "Subscribe To RSS Feed", "Follow By Email", and "Twitter"