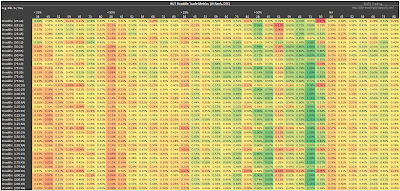
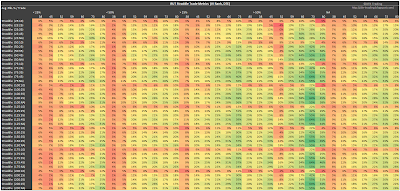
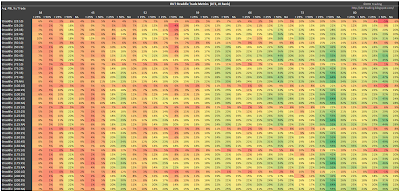
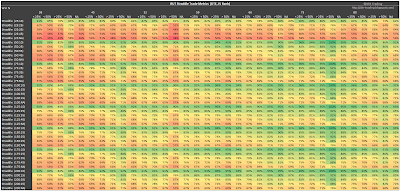
Below, you'll see the same trade metrics that I presented in my last post, but organized with the strategy variations in rows. For each trade metric category I've included two tables. The first table in each category has the DTE columns grouped by IVR. For example, the first seven DTE columns are associated with an IVR of < 25%. The second table in each category switches the groupings between DTE and IVR. For example, the first five IVR columns in the second table are associated with trades initiated at 38 DTE. Since I already discussed these results in my last post, I won't spend a lot of time describing the results below.
P&L Per Day
As we noticed in the first article, the largest P&L per day metrics were associated with an IVR > 50%. Recall that only two or three trades per year met this IVR filter criteria...so the green cells are associated with significantly fewer trades than the other cells...this could be a pro or a con depending on how you use this information. The 38, 45, and 73 DTE variations showed the highest readings in the IVR > 50% group.
 |
| (click to enlarge) |
 |
| (click to enlarge) |
P&L Per Trade
Same as above, the trades that met the IVR >50% criteria had the highest P&L per trade numbers. Only about 20 trades out of 100 met the IVR >50% criteria. For the non-IVR filtered category (NA), all 100+ trades were entered. The 38 DTE variations had the lowest P&L per trade readings, since they received lower credits and spent less DIT. The profit taking level of 10% was another area of lower P&L per trade readings, since these variations extracted the smallest percentage of the initial credit received.
 |
| (click to enlarge) |
 |
| (click to enlarge) |
Win Rate
The profit taking at 10% of the credit received, stands out in the tables below, although maybe not as clearly as in the win rate table in the last post.
 |
| (click to enlarge) |
 |
| (click to enlarge) |
Sortino Ratio
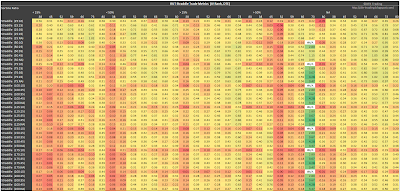
Columns of strength are apparent in the two tables below. The clustering of strength is much more clear in the Sortino table in the last article. That said, don't ignore some of the other solid numbers that are overshadowed by the 73 DTE, IVR > 50% readings. For example the non-IVR filtered regions (NA) at 59, 66, and 73 DTE.
 |
| (click to enlarge) |
 |
| (click to enlarge) |
Profit Factor
The Profit Factor region of strength matches the Sortino Ratio region of strength, and is associated with the IVR >50% filtered trades at 73 DTE.
 |
| (click to enlarge) |
 |
| (click to enlarge) |
Days In Trade (DIT)
The shortest DIT are associated with the trades entered at the lowest DTE. As the profit taking levels are increased, the trade duration is extended. Loss taking levels do not increase trade duration as much as increasing profit taking levels. The information in these tables can give you a sense of how long you should expect to stay in a trade as a percent of DTE.
 |
| (click to enlarge) |
 |
| (click to enlarge) |
Number Of Trades Entered
You'll enter the most trades (over 100) if you don't use the IVR filter...the second most trades occurred with the IVR < 50% filter. As I mentioned in the last article, one approach for the IVR > 50% filter could be as an indicator to increase position size for the 20% of trades that meet this criteria.
 |
| (click to enlarge) |
 |
| (click to enlarge) |
Total P&L
The greatest total P&L numbers occurred with the non-IVR filtered (NA) trade variations...the result of more occurrences.
 |
| (click to enlarge) |
 |
| (click to enlarge) |
If you want to check out the details behind the numbers shown in the tables above, take a look at my RUT Straddle Summary Page that lists links to all of the articles in the series.
Also, today and tomorrow I will tweet (@DTRTrading) tables that only show the heat map results for the non-IVR filtered trades. These might be interesting to traders that enter trades every month.
Follow my blog by email, RSS feed or Twitter (@DTRTrading). All options are available on the top of the right hand navigation column under the headings "Subscribe To RSS Feed", "Follow By Email", and "Twitter".
No comments:
Post a Comment