In this post we'll look at how the SPX straddle has been performing since I last analyzed its results back in 2015 (
here). For this article, we'll just look at the following variations and how they performed from January 2007 through December 2018:
- 59 DTE - (25:10) / 2 DTE - exit if the trade has a loss of 25% of its initial credit OR if the trade has a profit of 10% of its initial credit OR at 2 DTE.
- 59 DTE - (25:10) / 41 DTE - exit if the trade has a loss of 25% of its initial credit OR if the trade has a profit of 10% of its initial credit OR at 41 DTE.
- 59 DTE - (50:25) / 2 DTE - exit if the trade has a loss of 50% of its initial credit OR if the trade has a profit of 25% of its initial credit OR at 2 DTE.
- 59 DTE - (50:25) / 24 DTE - exit if the trade has a loss of 50% of its initial credit OR if the trade has a profit of 25% of its initial credit OR at 24 DTE.
- 45 DTE - (150:25) / 2 DTE - exit if the trade has a loss of 150% of its initial credit OR if the trade has a profit of 25% of its initial credit OR at 2 DTE.
- 45 DTE - (150:25) / 31 DTE - exit if the trade has a loss of 150% of its initial credit OR if the trade has a profit of 25% of its initial credit OR at 31 DTE.
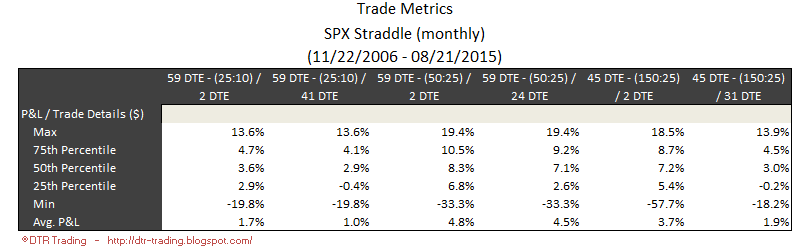
For these backtests, I used the Portfolio Margin (PM) requirements for straddles from TD/ThinkOrSwim from 13-Apr-2019. These numbers were $24K for 59 DTE straddles, and $25.5K for 45 DTE straddles. The performance of these variations in 2015 is shown in the tables below.
 |
| (click to enlarge) |
 |
| (click to enlarge) |
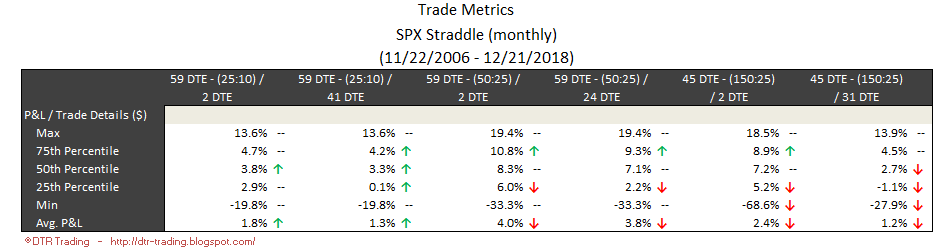
Now let's look at the metrics again, but adding in the results through December 2018. The tables below show the same metrics, but highlight which metrics have increased, which metrics have decreased, and which metric are unchanged.
 |
| (click to enlarge) |
 |
| (click to enlarge) |
The return metrics (top table) are a mixed bag across all variations. The 59 DTE - 25:10 variations showed performance improvements, the 59 DTE - 50:25 variations were flat/down, and the 45 DTE show performance deterioration. The 59 DTE - 25:10 variation also had improved metrics in the second table.
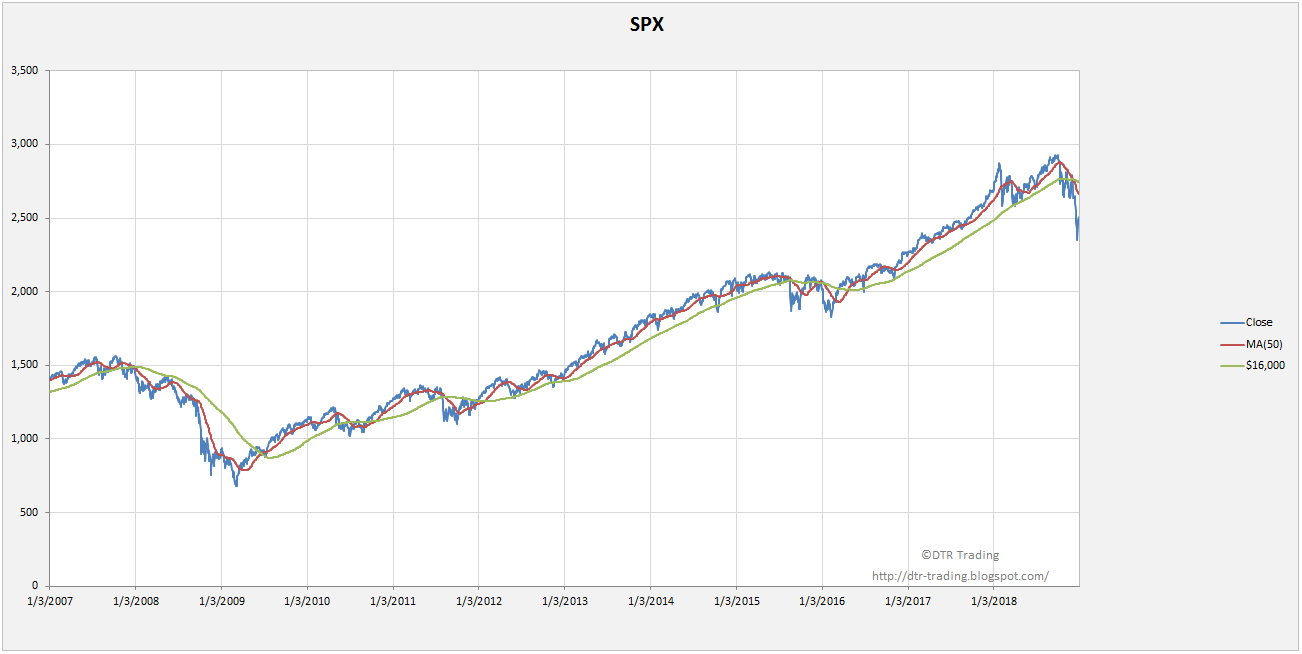
The corresponding equity curves for these variations are shown in the chart below, along with the chart of the SPX during this same time period.
 |
| (click to enlarge) |
 |
| (click to enlarge) |
In case you're interested, I've included the updated return percentages for each variation below.
 |
| (average return per year: 21.8%) |
 |
| (average return per year: 15.6%) |
 |
| (average return per year: 47.5%) |
 |
| (average return per year: 45.4%) |
 |
| (average return per year: 28.1%) |
 |
| (average return per year: 14.1%) |
2018 had some of the lowest returns for these straddles, with all the returns lower than their average annual returns.
If you don't want to miss my new blog posts, follow my blog either by email, RSS feed or by Twitter. All options are free, and are available on the top of the right hand navigation column under the headings "Subscribe To RSS Feed", "Follow By Email", and "Twitter". I follow blogs by RSS using Feedly, but any RSS reader will work.


No comments:
Post a Comment