You can find the prior SPX IC posts in this series at the links below:
- New Iron Condor Series Introduction
- 38 DTE SPX Iron Condor Results Summary
- 38 DTE SPX Iron Condor Results Summary - Part 2
- 45 DTE SPX Iron Condor Results Summary
- 45 DTE SPX Iron Condor Results Summary - Part 2
- 52 DTE SPX Iron Condor Results Summary
- 59 DTE SPX Iron Condor Results Summary
- 66 DTE SPX Iron Condor Results Summary
Normalized P&L per Day
The P&L per day values shown in the charts below are expressed as a percentage of the max risk for that test run. Each of the different wing width ICs (25 point, 50 point, 75 point) will have a different max risk, and it is important to normalize daily returns by the associated max risk number. For example, a 25 point IC will have slightly less than $25K max risk (margin), while a 75 point IC will have slightly less than $75K max risk (margin). Since the 25 point IC will have approximately 1/3 the risk/margin, the $ returns need to be normalized by these varying max risk / margin numbers for proper strategy variation comparison.
The results:
- We continue to see more variability in P&L per day readings in the 25 point wing ICs, than in the larger wing width ICs
- Similar to the prior test runs, as the delta of the short strikes increases, the variability in the P&L per day readings increases
- The largest reading was 0.17%, which is smaller than the largest reading for the 38, 45, and 59 DTE ICs. There was one strategy variation with a 0.17% value:
- ST (100:75), 25 point wings, 20 delta
- The next best readings came in at 0.16% and were associated with four test runs:
- ST (100:50), 25 point wings, 20 delta
- ST (NA:75), 25 point wings, 20 delta
- ST (300:75), 25 point wings, 20 delta
- ST (200:75), 25 point wings, 20 delta
- 46 strategy variations had P&L per day readings of 0.12% or greater:
- Of these 46, 35 used the standard balanced (ST) IC structure
- Of these 46, 30 used wing widths of 25 points
- Of these 46, 26 used the profit taking level of 50%
- Of these 46, 25 used a short strike delta of 20

 |
| (click to enlarge) |
Normalized P&L per Trade
The normalized P&L per trade charts display returns expressed as a percentage of the max risk for a given test run. As trade duration increases with increasing DTE, overall P&L per trade increases. Due to this fact, the max value of the y-axis on the 73 DTE P&L per trade charts was increased from 6% to 12%. The 16 delta and 20 delta variations had some values exceeding the 6% level.
The results:
- The variability in normalized P&L per trade again increases as the delta of the short strike increases, and decreases with increasing wing width
- In general, the returns per trade increase with increasing loss taking %, and this trend continues to be more pronounced as the trades move out in time / DTE
- The largest normalized P&L per trade was 9.1% and was associated with two strategy variations:
- ST (NA:75), 25 point wings, 20 delta
- ST (300:75), 25 point wings, 20 delta
- 112 variations had P&L per trade values of 5.0% or greater...this is a huge number!:
- 60 of these 112 were standard (ST) structures (34 were DN structures)
- 57 of these 112 used a short strike delta of 20 (44 used 16 delta)
- 51 of these 112 did not use a profit taking level (44 used the 50% level)
- 44 of these 112 did not use a loss taking exit (41 used the 300% level)
- 44 of these 112 used 25 point wings (41 used 50 point wings)
- The 73 DTE ICs have the largest average P&L per trade readings:
- 73 DTE: mean 3.92% / SD 1.73%
- 66 DTE: mean 2.79% / SD 1.09%
- 59 DTE; mean 2.75% / SD 1.20%
- 52 DTE: mean 2.33% / SD 0.88%
- 45 DTE: mean 2.23% / SD 0.87%
- 38 DTE: mean 1.88% / SD 0.75%

 |
| (click to enlarge) |
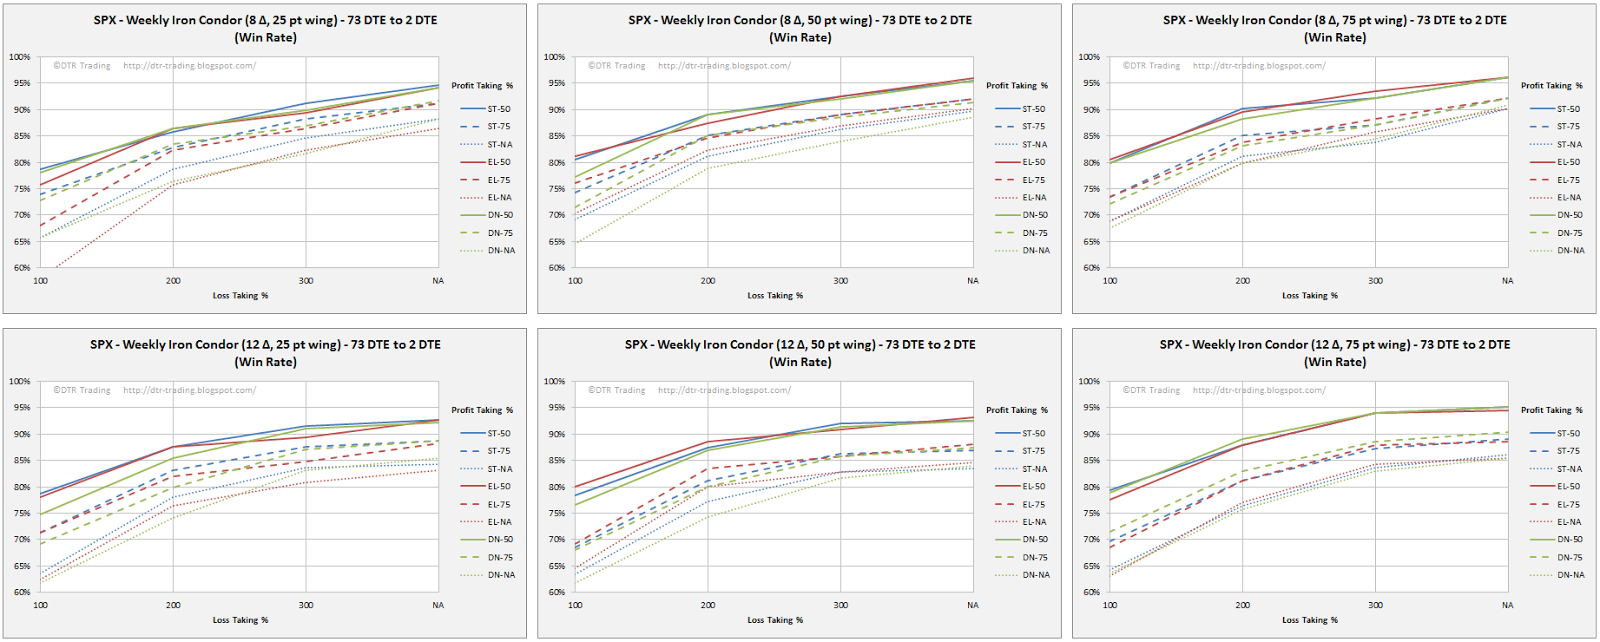
Win Rate
The win rate trends have been consistent across the DTEs tested:
- In general, win rates tend to increase as wing widths increase
- Win rates tend to decrease as the delta of the short strikes increases
- As the short strike delta increases to 16 and 20 delta, there is only a slight increase in win rate when taking losses greater than 200%
- The 50% profit taking level has the highest win rates
- The top win rate was 96%, and was associated with four strategies:
- ST (NA:50), wing width 75, 8 delta
- EL (NA:50), wing width 75, 8 delta
- DN (NA:50), wing width 75, 8 delta
- EL (NA:50), wing width 50, 8 delta
- 49 strategies had win rates of 91% or better:
- Of these 49, 39 took profits at 50%
- Of these 49, 31 did not use loss exits (they exited at 2 DTE; loss taking % = NA)
- Of these 49, 26 had short strike deltas of 8
- Of these 49, 22 had wing widths of 75 points
- The strategies with the top win rates also had some of the largest single losses...and this is consistent across the DTEs tested
 |
| (click to enlarge) |
Largest Loss
The next charts show the normalized largest loss for each of the test runs These largest losses are expressed as a percentage of the max risk found in the roughly 174 trades in each test run.
The results:
- Typically, the largest loss percentage increases with increasing loss taking level
- There were three strategy variations that had losses measurably greater than 100% of risk. They were the 25 point wing, 12 delta shorts, EL using a loss taking level of 300%. These variations hit a loss of 117% of risk due to bad data.
- This bad quote was associated with the 17-Sep-2011 expiration, and occurred on 24-Aug-2011. This was the same expiration that was hit with bad data in the 66 DTE trades.
- 43 strategy variations had largest loss readings of 95% or greater:
- Of these 43, 27 used wing widths of 25 points
- Of these 43, 25 used the ST structure
- None of the 43 used a loss taking level (loss taking % = NA)
- 42 strategy variations had largest losses that were 29% or smaller:
- Of these 42, 33 had short strike deltas of 8 and loss taking at 100%
- Of these 42, 21 used wing widths of 75 points
- Of these 42, 19 used the extra long put (EL) structure
- The top three smallest losses were associated with the following strategies:
- DN (100:50), 75 point wings, 8 delta -> 15% loss (win rate 82%)
- EL (100:75), 75 point wings, 8 delta -> 16% loss (win rate 72%)
- ST (100:50), 75 point wings, 8 delta -> 17% loss (win rate 77%)

 |
| (click to enlarge) |
Profit Factor
The profit factor results are listed below:
- Profit factors increase for variations not using a loss taking % (loss taking % = NA)
- This trend is more pronounced at the lower short strike deltas of 8 and 12
- 110 strategy variations had profit factors of 2.0 or greater...this is a big increase from the number of variations meeting this criteria at 66 DTE.
- 57 of these 110 did not use a loss taking exit (loss taking % = NA)
- 55 of these 110 used the delta neutral structure (DN)
- 49 of these 110 took profits at 50%
- 46 of these 110 had short strike deltas of 8
- The top tree performers were:
- DN (NA:50), 75 point wings, 12 delta -> profit factor of 3.1 (win rate 95%)
- DN (NA:50), 50 point wings, 8 delta -> profit factor of 3.0 (win rate 95%)
- EL (NA:50), 50 point wings, 8 delta -> profit factor of 3.0 (win rate 96%)

 |
| (click to enlarge) |
Average DIT For Winning Trades
This metric was derived by averaging all of the DIT for all of the winning trades in a test run. Adding a DIT exit to your profit and loss exits is worth considering.
The trends associated with this metric are consistent with the prior DTE test runs:
- As short strike deltas increase, trade duration increases
- As profit taking level increases, trade duration increases
- The 50% profit taking level should have you out of your trade between 21 and 42 days for a 73 DTE IC, depending on short strike delta
- The smallest winning trade DIT of 21 was associated with 8 delta short strikes, 25 point wings, profit taking at 50%, loss taking at 100%, and the EL structure. The same configuration but using either the ST or DN structures yielded a an average DIT for winning trades of 25
- There were 40 variations with winning trade DIT values less than 30:
- All 40 took profits at 50%
- 32 of these 40 used 8 delta short strikes
- 17 of these 40 used the loss taking level of 100%

 |
| (click to enlarge) |
Follow my blog by email, RSS feed or Twitter (@DTRTrading). All options are available on the top of the right hand navigation column under the headings "Subscribe To RSS Feed", "Follow By Email", and "Twitter".


