CustomMenu

Wednesday, January 28, 2015

RUT Iron Condor - Dynamic Exit Overview - 66 DTE

In this post, we will continue the work from the last post, RUT Iron Condor - Dynamic Exit Overview - 80 DTE, but this time we will look at the performance of several dynamic exits for the 66 days-to-expiration (DTE) RUT Iron Condors (IC).  We are going to backtest dynamic exits on three basic IC starting structures:

  • Standard: 10 put credit spreads, and 10 call credit spreads

  • Delta Neutral: 10 put credit spreads, and from 5 to 10 call credit spreads - the number is adjusted at trade initiation to create a delta neutral IC.  This structure will reduce losses when up moves occur during the life of the trade.

  • Extra Long Put: 10 put credit spreads, 10 call credit spreads, and 1 extra long put.  This structure will reduce losses when down moves occur during the life of the trade.

There are a number of approaches that we can take to dynamically exiting a trade, including:

  • Price Movement Exit - for example, if the market moves past the short strike of our put spread
  • Margin Loss % Exit - for example, if the loss on our position has exceeded 40% of the position margin 
  • Initial Credit % Loss Exit - for example, close the position for a loss if the P&L reaches 50% of the initial credit.
  • Initial Credit % Profit Exit - for example, close the position for a profit if the P&L reaches 60% of the initial credit.

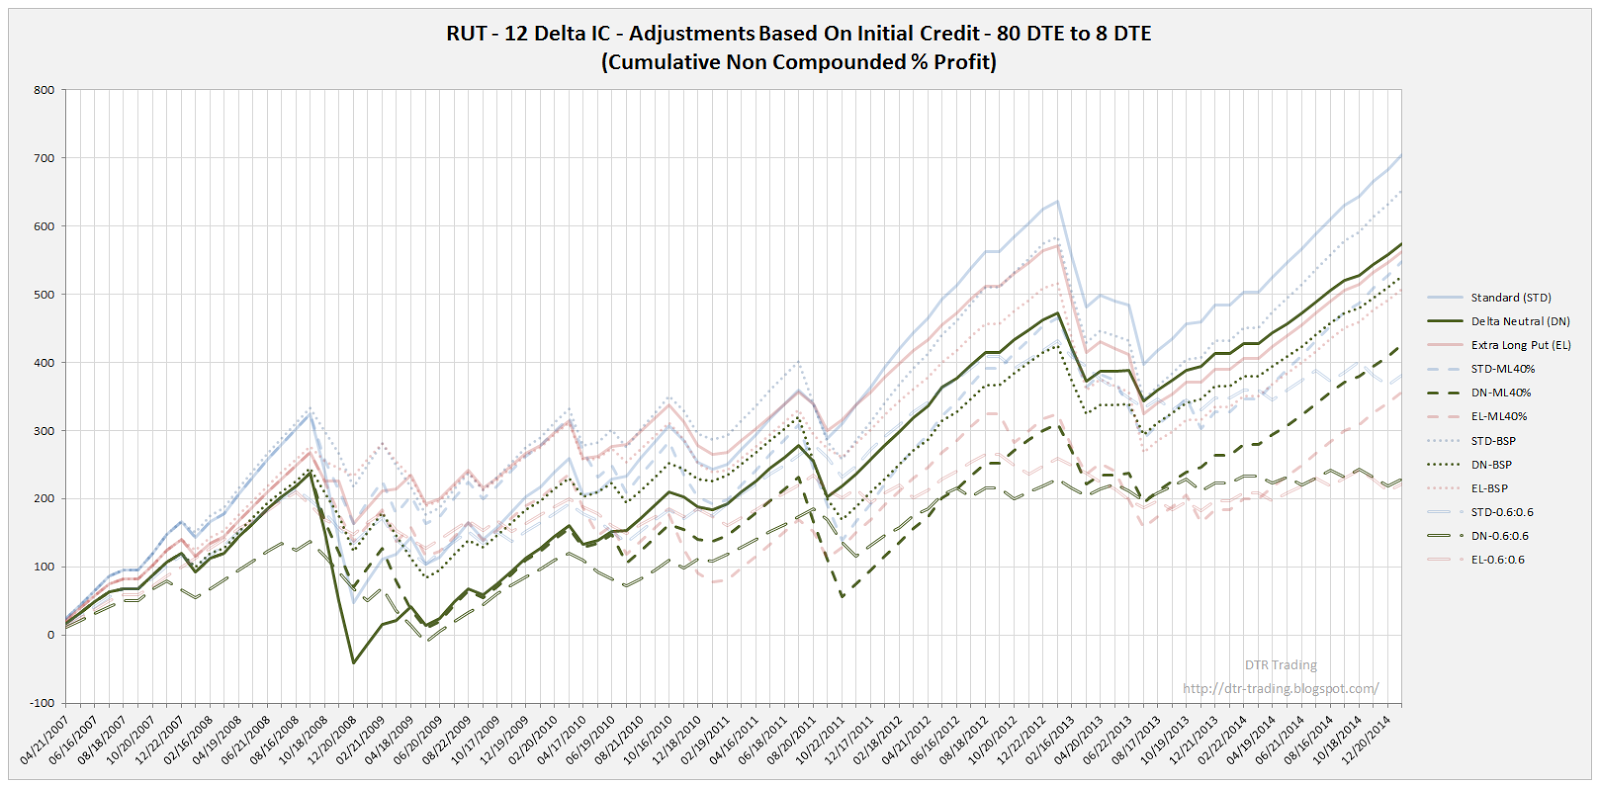
To see how these various exits perform, I have included a chart showing the equity curves (in percent terms) for the three starting structures (Standard [STD], Delta Neutral [DN], Extra Long Put [EL]) on the RUT at 66 DTE for the 12 delta short variation.

(click to enlarge)

This equity curve chart should look very similar to the equity curves in my prior posts, except for the fact that this chart is in percent rather than dollars.  In the chart above, all of the STD IC versions have blue equity curves, all of the DN IC versions have green equity curves, and all of the EL IC versions have red equity curves.  The solid lines represent the equity curves for the "no touch" version, while the dashed lines represent the equity curves for the dynamically exited versions.

There are three different exit versions shown in the chart above:

  • ML40% - this is a Margin Loss % Exit.  Trades using this exit strategy either exit at 8 DTE OR if the trade has a loss greater than 40% of the margin requirement for the trade. (ML40% = Max Loss 40%)
  • BSP - this is a Price Movement Exit.  Trades using this exit strategy either exit at 8 DTE OR if the price of the underlying (RUT) moves below the strike of the short put.  (BSP = Below Short Put).
  • 0.6:0.6 - This is an Initial Credit % Profit/Loss Exit. Trades using this exit strategy either exit at 8 DTE OR if the trade has a profit of 60% of its initial credit OR if the trade has a loss of 60% of its initial credit.  

In the chart below, I've highlighted just the Standard IC (STD) versions.  The SML40% exit version had the greatest profit of the STD strategies backtested, followed by the BSP exit, the STD version without dynamic stops, and finally the 0.6:0.6 exit.  Recall that for the 80 DTE strategies, the order was STD version without dynamic stops, BSP exit, ML40% exit, and 0.6:0.6 exit.

(click to enlarge)

In the next chart, I have highlighted just the Delta Neutral IC (DN) versions.  The SML40% exit version had the greatest profit of the DN strategies backtested, followed by the BSP exit, the DN version without dynamic stops, and finally the 0.6:0.6 exit....the same pattern we noticed in the STD strategies at 66 DTE.

(click to enlarge)

In this last chart, I have highlighted just the Extra Long Put IC (EL) versions.  The SML40% exit version had the greatest profit of the EL strategies backtested, followed by the BSP exit, the EL version without dynamic stops, and finally the 0.6:0.6 exit...the same pattern we noticed in the STD and DN 66 DTE strategies.

(click to enlarge)

There are at least two points to note in the above charts.  The first is that the three best performing strategies were versions of the STD strategy.  The second, is that the percentages have not been normalized...the margin requirement for every trade is different.  Therefore the denominator is different for every percent return.  If we normalize the percentages using the maximum margin required for all 1140 trades represented in the above equity curves....which happens to be $17,760...we get the normalized equity curve chart below.  This chart does not look too different from the non-normalized chart.

(click to enlarge)

If you don't want to miss my new blog posts, follow my blog either by email or by RSS feed.  Both options are free, and are available on the top of the right hand navigation column under the headings "Follow By Email" and "Subscribe To RSS Feed".  I follow blogs by RSS using Feedly, but any RSS reader will work.

Sunday, January 25, 2015

RUT Iron Condor - Dynamic Exit Overview - 80 DTE

It has taken a long time to get to this point, but we are finally finished reviewing the backtests for our three basic starting structures for the Iron Condor (IC).  The three basic starting structures backtested were:

  • Standard: 10 put credit spreads, and 10 call credit spreads
    (72 total backtests / more than 80 trades per backtest)

  • Delta Neutral: 10 put credit spreads, and from 5 to 10 call credit spreads - the number is adjusted at trade initiation to create a delta neutral IC.  This structure will reduce losses when up moves occur during the life of the trade.
    (32 total backtests / more than 80 trades per backtest)

  • Extra Long Put: 10 put credit spreads, 10 call credit spreads, and 1 extra long put.  This structure will reduce losses when down moves occur during the life of the trade.
    (32 total backtests / more than 80 trades per backtest)

We looked at how the three structures performed on the Russell 2000 Index (RUT) and the S&P 500 Index (SPX).  We also looked at how the Standard structure performed on the NASDAQ 100 Index (NDX).

For each basic starting structure and underlying, we backtested between four and six different days-to-expiration (DTE) starting points for our trades:

  • 24 DTE
  • 31 DTE
  • 38 DTE
  • 52 DTE
  • 66 DTE
  • 80 DTE

For each of these DTE starting points tested, we looked at variations where the starting short strikes were 8 delta, 12 delta, 16 delta, and 20 delta.  We now have a solid understanding of how each structure/underlying/DTE/delta combination performed between 2007 and mid-2014 when traded in a "no touch" manner.

With this post, we will start to explore dynamic exits from the different versions and variations of IC that we have tested so far.  There are a number of approaches that we can take to exit a trade, including:

  • Price Movement Exit - for example, if the market moves past the short strike of our put spread
  • Margin Loss % Exit - for example, if the loss on our position has exceeded 40% of the position margin 
  • Initial Credit % Loss Exit - for example, close the position for a loss if the P&L reaches 50% of the initial credit.
  • Initial Credit % Profit Exit - for example, close the position for a profit if the P&L reaches 60% of the initial credit.

I could go on, but you get the idea.  At a minimum, we will backtest the above exits on some of our starting structure/underlying/DTE/delta combinations.  

To see how these exits perform, I have included a chart showing the equity curves (in percent terms) for the three starting structures (Standard [STD], Delta Neutral [DN], Extra Long Put [EL]) on the RUT at 80 DTE for the 12 delta short variation.  I have updated my historical options data through Friday, so these backtests start on January 1, 2007 and run through this month's expiration.

(click to enlarge)

This equity curve chart should look very similar to the equity curves in my prior posts, except for the fact that this chart is in percent rather than dollars...in order to more easily compare the different curves.  In the chart above, all of the STD IC versions have blue equity curves, all of the DN IC versions have green equity curves, and all of the EL IC versions have red equity curves.  The solid lines represent the equity curves for the "no touch" version, while the dashed lines represent the equity curves for the dynamically exited versions.

There are three different exit versions shown in the chart above:

  • ML40% - this is a Margin Loss % Exit.  Trades using this exit strategy either exit at 8 DTE OR if the trade has a loss greater than 40% of the margin requirement for the trade. (ML40% = Max Loss 40%)
  • BSP - this is a Price Movement Exit.  Trades using this exit strategy either exit at 8 DTE OR if the price of the underlying (RUT) moves below the strike of the short put.  (BSP = Below Short Put).
  • 0.6:0.6 - This is an Initial Credit % Profit/Loss Exit. Trades using this exit strategy either exit at 8 DTE OR if the trade has a profit of 60% of its initial credit OR if the trade has a loss of 60% of its initial credit.  

In the chart below, I have highlighted just the Standard IC (STD) versions.  The STD version without dynamic stops has the largest overall performance of the STD strategies, followed by the BSP exit, the ML40% exit, and finally the 0.6:0.6 exit.

(click to enlarge)

In the next chart, I have highlighted just the Delta Neutral IC (DN) versions.  The DN version without dynamic stops has the largest overall performance of the DN strategies, followed by the BSP exit, the ML40% exit, and finally the 0.6:0.6 exit...the same pattern we noticed in the STD strategies.

(click to enlarge)

In this last chart, I have highlighted just the Extra Long Put IC (EL) versions.  The EL version without dynamic stops has the largest overall performance of the EL strategies, followed by the BSP exit, the ML40% exit, and finally the 0.6:0.6 exit...the same pattern we noticed in the STD and DN strategies.

(click to enlarge)

There are at least two points to note in the above charts.  The first is that the STD strategy without dynamic exits has the best overall performance.  The second, is that the percentages have not been normalized...the margin requirement for every trade is different.  Therefore the denominator is different for every percent return.  If we normalize the percentages using the maximum margin required for all 1128 trades represented in the above equity curves....which happens to be $17,700...we get the normalized equity curve chart below.  This chart does not look to different from the non-normalized chart.

(click to enlarge)

In the next post I will provide a similar overview for the 66 DTE IC versions.

If you don't want to miss my new blog posts, follow my blog either by email or by RSS feed.  Both options are free, and are available on the top of the right hand navigation column under the headings "Follow By Email" and "Subscribe To RSS Feed".  I follow blogs by RSS using Feedly, but any RSS reader will work.

Sunday, January 18, 2015

RUT Iron Condor Equity Curve Comparison - 66 DTE

In this post we will look at the equity curves for the three versions of the RUT "no touch" Iron Condor (IC) trades at 66 days to expiration (DTE).  The three versions tested were:
  • Standard: 10 put credit spreads, and 10 call credit spreads

  • Delta Neutral: 10 put credit spreads, and from 5 to 10 call credit spreads - the number is adjusted at trade initiation to create a delta neutral IC.  This structure will reduce losses when up moves occur during the life of the trade.

  • Extra Long Put: 10 put credit spreads, 10 call credit spreads, and 1 extra long put.  This structure will reduce losses when down moves occur during the life of the trade.

Like the last post, the equity curves images below are from the original posts where they were first displayed, and have purposely not been updated here.  The first image shows the equity curves for the four delta variations of the Standard IC at 66 DTE.


(click to enlarge)

The next image shows the equity curves for the delta neutral (DN) version of this same trade.  Recall that the DN version of the trade used the same start and end dates as the standard version, as well as the same strike positions.  The only difference between the two trades is that the DN version was initiated with the position deltas close to 0.  This was accomplished by having fewer call credit spreads in the DN version than the Standard version.

(click to enlarge)

When you compare the DN equity curves with the Standard equity curves it is visually apparent that the drawdowns in an up-trending market are lower in the DN version than the Standard version.  This would cover the majority of the time since early 2009.  Also note that this is the same pattern that we noticed in the 80 DTE versions.

The next image shows the equity curves for the Extra Long Put (EL) version of the same trade.  Recall that the EL version of this trade also used the same start and end dates as the standard version as well as the same strike positions.  The only difference between the EL version and the Standard version was one additional long put at the same strike as the long puts in the put credit spreads.

(click to enlarge)
Again, similar to the 80 DTE version, this EL version had significantly lower drawdowns during the market drop in late 2008 through through early 2009.  Its performance since that time is lower than the Standard version though, due to the additional cost of being net long.

In the next post I will start reviewing the automated backtesting of IC versions that are exited based on some threshold.

If you don't want to miss my new blog posts, follow my blog either by email or by RSS feed.  Both options are free, and are available on the top of the right hand navigation column under the headings "Follow By Email" and "Subscribe To RSS Feed".  I follow blogs by RSS using Feedly, but any RSS reader will work.

Wednesday, January 14, 2015

RUT Iron Condor Equity Curve Comparison - 80 DTE

In this post we will look at the equity curves for the three versions of the RUT "no touch" Iron Condor (IC) trades at 80 days to expiration (DTE).  The three versions tested were:
  • Standard: 10 put credit spreads, and 10 call credit spreads

  • Delta Neutral: 10 put credit spreads, and from 5 to 10 call credit spreads - the number is adjusted at trade initiation to create a delta neutral IC.  This structure will reduce losses when up moves occur during the life of the trade.

  • Extra Long Put: 10 put credit spreads, 10 call credit spreads, and 1 extra long put.  This structure will reduce losses when down moves occur during the life of the trade.

The equity curves images below are from the original posts where they were first displayed, and have purposely not been updated here.  The first image shows the equity curves for the four delta variations of the Standard IC at 80 DTE.

(click to enlarge)

The next image shows the equity curves for the delta neutral (DN) version of this same trade.  Recall that the DN version of the trade used the same start and end dates as the standard version, as well as the same strike positions.  The only difference between the two trades is that the DN version was initiated with the position deltas close to 0.  This was accomplished by having fewer call credit spreads in the DN version than the Standard version.

(click to enlarge)

When you compare the DN equity curves with the Standard equity curves it is visually apparent that the drawdowns in an up-trending market are lower in the DN version than the Standard version.  This would cover the majority of the time since early 2009.

The next image shows the equity curves for the Extra Long Put (EL) version of the same trade.  Recall that the EL version of this trade also used the same start and end dates as the standard version as well as the same strike positions.  The only difference between the EL version and the Standard version was one additional long put at the same strike as the long puts in the put credit spreads.

(click to enlarge)
As we would expect, this EL version had significantly lower drawdowns during the market drop in late 2008 through through early 2009.  Its performance since that time is lower than the Standard version though, due to the additional cost of being net long.

In the next post I will review the equity curves for the three versions of the RUT "no touch" IC trades (standard, delta neutral, and extra long put) at 66 DTE.  After the next post, I will move on to automated backtesting of versions that are exited based on some threshold.

If you don't want to miss my new blog posts, follow my blog either by email or by RSS feed.  Both options are free, and are available on the top of the right hand navigation column under the headings "Follow By Email" and "Subscribe To RSS Feed".  I follow blogs by RSS using Feedly, but any RSS reader will work.

Sunday, January 11, 2015

SPX Iron Condor Comparisons

In this post we will look at the backtest results (summary statistics) for the three versions of the SPX "no touch" Iron Condor (IC) trades.  The three versions tested were:
  • Standard: 10 put credit spreads, and 10 call credit spreads

  • Delta Neutral: 10 put credit spreads, and from 5 to 10 call credit spreads - the number is adjusted at trade initiation to create a delta neutral IC.  This structure will reduce losses when up moves occur during the life of the trade.

  • Extra Long Put: 10 put credit spreads, 10 call credit spreads, and 1 extra long put.  This structure will reduce losses when down moves occur during the life of the trade.

The non-compounded annual growth rates for the three versions of the SPX "no touch" IC trades are shown in the first table.  The returns for the SPX ICs are highly variable across the three versions.  There are a couple of patterns that stand out though.  The first is that the 20 delta Extra Long Put version has the lowest returns of all of the trades at the 80, 66, and 52 DTE variations.  The second pattern is that the Delta Neutral version has the tightest return range across deltas for a given DTE, than the other two versions...for the 80, 52, and 38 DTE variations.  For example, at 80 DTE the Standard IC return range is 29.2% (51.4% - 22.2%), the Delta Neutral IC return range is 25.5% (54.8% - 29.3%), and the Extra Long Put IC return range is 36.0% (53.6% - 17.6%).  The Delta Neutral version appears to have the most stable returns across DTE and delta variations.
(click to enlarge)


The percent of winning trades for each of the three trade versions is shown in the next table.   The Delta Neutral version has higher win rates for nearly all of the DTE and delta variations. The Standard and Extra Long Put versions have fairly close win rates across most of the DTE and delta variations.
(click to enlarge)

In general the starting structure of each of the three versions does not have a huge impact on win rate...all three versions are fairly similar in terms of win rate.

The best trade for each of the three trade versions is shown in the next table.  As we would expect, the Standard version has the best trade (in terms of percent return) for each DTE / delta combination except for the 52 DTE / 20 delta variation.  The Stanrdard IC version contains more credit spreads than the Delta Neutral version, and does not pay for an extra long as with the Extra Long Put version.
(click to enlarge)


The worst trade for each of the three trade versions is shown in the next table.  In all but the 80 DTE / 16 delta variation, the version with the smallest worst trade is the Extra Long Put version.  This suggests that the the worst trades across the time period tested occurred to the downside...where the extra long put reduced the loss.
(click to enlarge)


Additional summary statistics for all of the trade versions across all DTE and short strike deltas is shown in the table below.
(click to enlarge)

You can get a copy of the above data, as well as all of the other summary statistics for these trades, by downloading the spreadsheet from the following page:
http://dtr-trading.blogspot.com/p/the-summary-statistics-for-no-touch-spx.html

The details associated with each of the backtests can be found in the posts below:
In the next post I will review the equity curves for the three versions of the RUT "no touch" IC trades (standard, delta neutral, and extra long put) at 80 DTE.

If you don't want to miss my new blog posts, follow my blog either by email or by RSS feed.  Both options are free, and are available on the top of the right hand navigation column under the headings "Follow By Email" and "Subscribe To RSS Feed".  I follow blogs by RSS using Feedly, but any RSS reader will work.

Wednesday, January 7, 2015

RUT Iron Condor Comparisons

In this post we will look at the backtest results (summary statistics) for the three versions of the RUT "no touch" Iron Condor (IC) trades.  The three versions tested were:
  • Standard: 10 put credit spreads, and 10 call credit spreads

  • Delta Neutral: 10 put credit spreads, and from 5 to 10 call credit spreads - the number is adjusted at trade initiation to create a delta neutral IC.  This structure will reduce losses when up moves occur during the life of the trade.

  • Extra Long Put: 10 put credit spreads, 10 call credit spreads, and 1 extra long put.  This structure will reduce losses when down moves occur during the life of the trade.

The non-compounded annual growth rates for the three versions of the RUT "no touch" IC trades are shown in the first table.  The returns are fairly similar at higher days to expiration (DTE) (e.g. 80 DTE), but then start to diverge at lower DTE (e.g. 38 DTE).  The lower DTE strikes have less implied volatility (IV), and the long options in the credit spreads help the overall position less during underlying price movement (delta and gamma).
(click to enlarge)


The percent of winning trades for each of the three trade versions is shown in the next table.   At 80 DTE, the Delta Neutral and Extra Long Put versions have higher win rates.  At 66 DTE, there is not a strong pattern present between the versions and their short strike deltas...the three versions have approximately the same win rate for a given short strike delta.  At 52 DTE, the Standard version has the lowest win rate across deltas.  This pattern reverses at 38 DTE, with the Standard version having the highest win rate across short strike deltas.
(click to enlarge)

The starting structure of each of the three versions does not have a large impact on win rate in general...all three versions are fairly similar in terms of win rate.

The best trade for each of the three trade versions is shown in the next table.  As we would expect, the Standard version always has the best trade (in terms of percent return) for each DTE / delta combination.  This version contains more credit spreads than the Delta Neutral version, and did not pay for an extra long as with the Extra Long Put version.  At higher DTE, the next best is the Delta Neutral version...and this is related to not paying for the extra long that was needed in the Extra Long Put version.
(click to enlarge)


The worst trade for each of the three trade versions is shown in the next table.  In general, the version with the smallest worst trade is the Extra Long Put version.  This suggests that the the worst trades across the time period tested occurred to the downside...where the extra long put reduced the loss.
(click to enlarge)


Additional summary statistics for all of the trade versions across all DTE and short strike deltas is shown in the table below.
(click to enlarge)

You can get a copy of the above data, as well as all of the other summary statistics for these trades, by downloading the spreadsheet from the following page:
http://dtr-trading.blogspot.com/p/backtesting-statistics.html

The details associated with each of the backtests can be found in the posts below:

In the next post I will compare the summary statistics for the three versions of the SPX "no touch" IC trades (Standard, Delta Neutral, and Extra Long Put).

If you don't want to miss my new blog posts, follow my blog either by email or by RSS feed.  Both options are free, and are available on the top of the right hand navigation column under the headings "Follow By Email" and "Subscribe To RSS Feed".  I follow blogs by RSS using Feedly, but any RSS reader will work.

Sunday, January 4, 2015

Extra Long Put Iron Condor - Summary Statistics

In this post, we will look at the summary statistics for just the RUT and SPX delta neutral ICs.  The image below shows the summary statistics of the RUT delta neutral IC version for all of the days-to-expiration (DTE) and all of the short strike deltas shown on this blog.  The Sharpe Ratio and Sortino ratios are the best for the 66 DTE, 12, 16 and 20 delta variations.


The next image shows the summary statistics for the SPX delta neutral IC version for all of the DTE, and all of the short strike deltas shown on this blog.  The Sharpe Ratio and Sortino ratios are the best for the 80 DTE, 8 delta variation, and the 52 DTE, 8 and 12 delta variations.


The details associated with the prior two images can be found at the links below:
In the next post I will compare the summary statistics for the three versions of the RUT "no touch" IC trades (standard, delta neutral, and extra long put).  We will see how the initial structure of the IC impacts the summary statistics.

If you don't want to miss my new blog posts, follow my blog either by email or by RSS feed.  Both options are free, and are available on the top of the right hand navigation column under the headings "Follow By Email" and "Subscribe To RSS Feed".  I follow blogs by RSS using Feedly, but any RSS reader will work.