During the last several posts, we expanded our Iron Condor exit analysis to include results where trades were held to higher loss thresholds. You can review both the first and second sets of articles at the following pages:
This post will review the combined trade metrics from both sets of articles for the Iron Condors on the RUT. I've also expanded the range of all of the results through the April 2015 expiration. We will look at how the high loss threshold strategy variations compare to the lower loss threshold strategy variations, as well as the different starting structures. As a bit of review, the first series looked at the following three starting structures for iron condors:
- Standard (STD) - an iron condor with an equal number of put and call credit spreads.
- Delta Neutral (DN) - an iron condor with fewer call credit spreads than put credit spreads in order to create a position delta near 0. This structure performs better in an advancing market.
- Extra Long Put (EL) - a Standard iron condor with one additional long put for every 10 put credit spreads. This structure performs better in a declining market.
For each of these three starting structures, we looked at iron condors with different delta short strikes (8, 12, 16, and 20 delta) at different days to expiration (38, 45, 52, 59, 66, and 80). For each of these combinations I ran backtests from the January 2007 expiration through the April 2015 expiration, with the following dynamic exits:
- Exit at 8 DTE
- ML40% - exit when the loss is equivalent to 40% of the margin for the position OR 8 DTE
- BSP - exit when the market is below the strike of the short put (BSP) OR 8 DTE
- 0.6:0.6 - exit if the trade has a loss of 60% of its initial credit OR if the trade has a profit of 60% of its initial credit OR 8 DTE
- 0.6:0.9 - exit if the trade has a loss of 60% of its initial credit OR if the trade has a profit of 90% of its initial credit OR 8 DTE
- 0.7:0.9 - exit if the trade has a loss of 70% of its initial credit OR if the trade has a profit of 90% of its initial credit OR 8 DTE
- 0.8:0.9 - exit if the trade has a loss of 80% of its initial credit OR if the trade has a profit of 90% of its initial credit OR 8 DTE
For the Standard (STD) structure only, I additionally analyzed the results for the following dynamic exits:
- STD - NA%:NA% - exit at 8 DTE -- this is the same as item 1 above.
- STD - NA%:50% - exit if the trade has a profit of 50% of its initial credit OR 8 DTE.
- STD - 100%:50% - exit if the trade has a loss of 100% of its initial credit OR if the trade has a profit of 50% of its initial credit OR 8 DTE.
- STD - 200%:50% - exit if the trade has a loss of 200% of its initial credit OR if the trade has a profit of 50% of its initial credit OR 8 DTE.
- STD - 200%:75% - exit if the trade has a loss of 200% of its initial credit OR if the trade has a profit of 75% of its initial credit OR 8 DTE.
- STD - 300%:50% - exit if the trade has a loss of 300% of its initial credit OR if the trade has a profit of 50% of its initial credit OR 8 DTE.
- STD - 300%:75% - exit if the trade has a loss of 300% of its initial credit OR if the trade has a profit of 75% of its initial credit OR 8 DTE.
- STD - 400%:50% - exit if the trade has a loss of 400% of its initial credit OR if the trade has a profit of 50% of its initial credit OR 8 DTE.
Before we get into the results, I should probably describe the table format that I am using to display the results. The first column lists the strategy variation, including the exit used. This column uses the strategy description nomenclature that I used in the last several months worth of posts. Next, there are four groups of six columns. Each group corresponds to a different short strike delta, and each of the six columns in the group corresponds to a different DTE starting point. Hopefully this makes sense, but feel free to submit a comment for this post if you'd like me to clarify the format / nomenclature further.
The first table, shows the average normalized P&L per day by delta, DTE, and strategy. It's easy to see that the highest daily returns are concentrated in the STD starting structure with 20 delta shorts, and a starting DTE in the 59 to 66 range. Also, the shorter DTE (38 - 45) with the higher loss thresholds were another area of high daily returns.
 |
| (click to enlarge) |
The second table shows the average P&L per trade by delta, DTE, and strategy. It's clear from this table that the highest overall returns were concentrated in the 16 and 20 delta variations at 59 to 80 DTE. The 12 delta short strike variations also exhibited this same DTE trend. Additionally, as a group, the 20 delta, 66 DTE variations with lower risk:reward exits had the highest returns.
 |
| (click to enlarge) |
The third table, below, shows the win percent / win rate by delta, DTE, and strategy. The highest win rates are concentrated with the 8 delta short strike strategy variations, and also in the STD high loss strategy variations (across deltas). Basically, the greater your tolerance for unrealized losses, the higher your win rate...this was evident by the variations that were the darkest green in the table below. Another interesting point is that at 8 delta, the DTE did not have a big impact on the win rate if your risk tolerance was high.
 |
| (click to enlarge) |
In the fourth table, we see the Sortino Ratio by delta, DTE, and strategy. The highest Sortino's were present with the 59 to 66 DTE variations with the low risk:reward exits...this trend was persistent across starting structure and short strike deltas...but strongest at 8 delta.
 |
| (click to enlarge) |
The fifth table shows the profit factor metric by delta, DTE and strategy. The highest profit factors were present in the 59 to 66 DTE strategy variations, as evident by the presence of the dark green cells below. In addition, the 8 delta short strike strategy variations have the highest profit factor numbers. At 8 delta, the 38 and 45 DTE variations also were an area of profit factor strength.
 |
| (click to enlarge) |
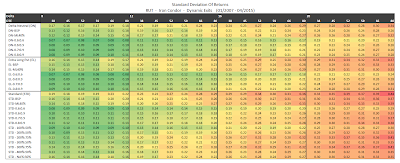
Lastly, table six displays the standard deviations of returns by delta, DTE, and strategy. In this table, the lower the SD number, the darker green the cell in the table. The lowest standard deviations of returns were concentrated with the 8 delta strategy variations. The low risk:reward variations were the strongest at 8 delta, and this strength extended into the other short strike deltas.
 |
| (click to enlarge) |
So when should you exit your Iron Condor? As usual, it depends on what metric is most important to you.
Highest Return Per Day / Per Trade - I would concentrate on the STD structure, 59 to 66 DTE, 20 delta short strike variations with a low risk:reward exit: STD-0.6:0.9, STD-0.7:0.9, STD-0.8:0.9.
Highest Win Rate - I would look at the 8 delta short strike variations, and a trade imitation at 59 to 80 DTE. My preference here, would be for one of the following exit variations: STD-200%:50%, STD-200%-75%, STD-300%-50%, or STD-300%-75%. There are other variations that work as well, but these are my favorites in this category.
Sortino Ratio - I wouldn't select a trade solely on the Sortino Ratio. I would look for the intersection of Sortino and returns, for example. In this case, the same variations that were selected in the highest return per day / per trade category also have decent Sortino numbers.
Profit Factor - I would use the same approach for Profit Factor as I used for Sortino Ratio. I would look for the intersection of high Profit Factor numbers and some other criteria (for example daily returns).
Standard Deviation of Returns - Any of the starting structures and DTE at 8 delta have low standard deviations of returns...as long as a risk reward exit is used. Take your pick here...but I would gravitate towards the STD low risk:reward variations.
There are really two main trade approaches that jump out at me when reviewing these results:
1) You can either use high delta short strikes (20 delta) in the 59 to 66 DTE range - exited early (60% to 80%) when there is a loss
OR
2) You can use lower delta short strikes (8 delta) in the 59 to 66 DTE range - and allow your unrealized (and possibly realized!) losses to get fairly large (200% to 300%) during the life of the trade.
Either of these general approaches will work.
If you don't want to miss my new blog posts, follow my blog either by email, RSS feed or by Twitter. All options are free, and are available on the top of the right hand navigation column under the headings "Subscribe To RSS Feed", "Follow By Email", and "Twitter". I follow blogs by RSS using Feedly, but any RSS reader will work.


