As with the other tests, in these backtests there will be no adjustments during the trade and no hedging to start the positions leaning one direction or another. Many of these settings are available in the backtester, but we will continue to look at this basic IC case. Here are the setup details:

(1) The backtester will start looking for trades that meet the entry DTE requirement after this date
(2) The backtester will not take any trades that will have an exit DTE after this date
(3) Some trading platforms call 52 DTE, 50 DTE (e.g., TOS). The OSB uses a DTE based on the number of days to the expiration date in the option code/opra code, which is a Saturday for indexes
(4) Some trading platforms call 8 DTE, 6 DTE (e.g., TOS)
(5) Russell 2000 Index options
(6) Four 52 DTE "no-touch" condors will be tested with their short strikes at varying deltas (8, 12, 16, and 20)
(7) The distance between the short call and long call (also, the distance between the short and long puts)
The equity curves for each of the four strategies are shown in the graph below. In addition to the equity curves, the ATM IV at trade initiation is also plotted (the average of the ATM call and ATM put). Also, the dates in the chart are expiration dates.
If I pick a random expiration date, for example 03/22/2008, we can see that when the trade was initiated, the ATM IV was 31. When the trade was closed, the cumulative non-compounded profit had grown to between $21.5k and $30.4k depending on the short delta of the strategy.

In the table below are the standard trade metrics for the four ICs with different short strikes (8 delta, 12 delta, 16 delta, and 20 delta).

We can look at just the 12 delta of this IC in a bit more detail. In the heat map below, we can see the performance by expiration month of each of the individual trades of each of these strategies. The 0% cells represent expiration months were no trade was initiated. Some of these 0% cells are due to lack of data or bad prints on the trade entry day...leading the backtester to skip that month for testing.

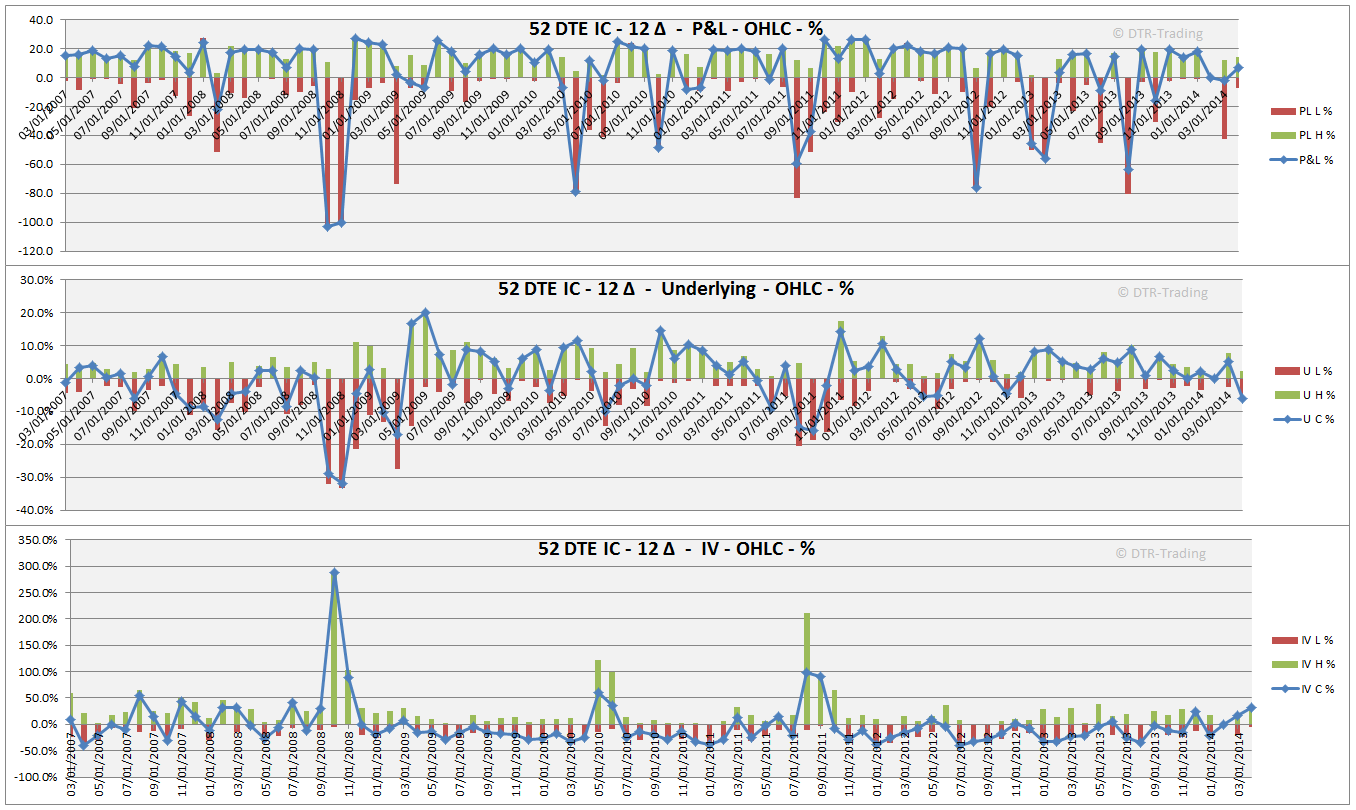
We can also look at the 12 delta IC in terms of the P&L range (in %), range of the underlying (in %), and IV range (in %), for each trade by expiration month. This data is shown in the three graphs below. These graphs are showing the open, which is the 0% level, the high (green bar), the low (red bar), and the value at trade close (the blue line). Also, note that the months shown on the horizontal axis are not displaying expiration dates in order to make the chart less cluttered with axis labels.
The top graph displays P&L range. You can see that when the trade closes profitably, the range is mostly on the positive side of the graph, with losing trades being exactly the opposite.
The middle graph shows the range of the underlying, the RUT, in percent terms during the life of each trade. With a bullish bias for US indexes, it's not surprising to see that it is more common for the market to finish higher relative to the day the ICs were entered.
The bottom graph shows the ATM IV range and closing value in percent terms, during the life of each IC trade. IV decays to zero as we approach expiration, so you would expect these bars to be mostly red, with the closing value to be negative (the blue line). There were several times where ATM IV finished higher, and green...usually when there were market drops...as expected.
In the next backtesting post I will look at this same IC entered at 38 DTE, two weeks later than this test. Drop me a note if you'd like to see different data presented, and I'll do my best to incorporate your suggestions in the next post or two.
No comments:
Post a Comment