CustomMenu

Sunday, October 4, 2015

SPX Straddle - 52 DTE - Manage Profits at 10%

In this post we look at the backtest results of selling a one-lot, at-the-money (ATM) straddle on the S&P 500 Index (SPX), initiated at 52 days-to-expiration (DTE).  In this second post of five on 52 DTE straddles, we look at trades that use the same loss exits as shown in the first post, and in addition, take profits at 10% of the credit received.  The results displayed in this post represent data from 824 individual trades entered by the automated backtester.

For background on the setup for the backtests, as well as the nomenclature used in the charts and tables below, please see the introductory article for this series: Option Straddle Series - P&L Exits.

In the trade metrics tables, some of the metrics rows have been highlighted to indicate values that are in the upper half of the readings.  One of the metrics to note is the average P&L per day in percentage terms (P&L % / Trade - Avg. P&L / Day).  This is a measure of the P&L per day normalized to the maximum initial portfolio margin (initial PM) required for that trade run...it tells us the effectiveness of theta with respect to our margin requirement.  Also note that the y-axis scale is the same in all of the 52 DTE equity curves.


No IV Rank Filter

In this section we will look at the results of entering one trade for every monthly expiration regardless of the implied volatility rank (IVR) of the SPX on the date of entry.  Entering these trades at 52 DTE and utilizing our loss exits and 10% credit exits (described here), resulted in the equity curves below.  Very solid performance for several of the variations since mid-2012.

SPX Short Options Straddle Equity Curves - 52 DTE - Risk:Reward 10% Exits
(click to enlarge)

The trade metrics for these different exits are shown in the table below.  A number of the variations have win rates at 91%...but all variations had trouble at the end of 2008.  The (125:10) variation had the highest P&L % / day reading, highest overall P&L % value, and the highest win rate (tied with five other variations).

SPX Short Options Straddle Trade Metrics - 52 DTE - Risk:Reward 10% Exits
(click to enlarge)

The table below shows the distribution of returns in five-number summary format.  Hat-tip to tastytrade.

SPX Short Options Straddle 5 Number Summary - 52 DTE - Risk:Reward 10% Exits
(click to enlarge)

Below are three sets of scatter plots for selling 52 DTE ATM SPX straddles. The first image contains one scatter plot per strategy and shows P&L in percentage terms versus IVR for the SPX. The IVR was captured on the day each trade was initiated.  There is a trend of increasing P&L with increasing IVR...a trend that has repeated across all of the tests.

SPX Short Options Straddle Scatter Plot IV Rank versus P&L - 52 DTE - Risk:Reward 10% Exits
(click to enlarge)

The next image shows P&L in percentage terms versus initial ATM IV. This ATM IV was captured on the day each trade was initiated.  Higher IV resulted in higher returns, but the majority of all trades occurred at lower IV, below 35.

SPX Short Options Straddle Scatter Plot IV versus P&L - 52 DTE - Risk:Reward 10% Exits
(click to enlarge)

The third image shows P&L in percentage terms versus days-in-trade (DIT).  When managing losses early (25%,  50%), the losses were fairly evenly distributed across DIT.  As the loss management becomes less aggressive (125%, 150%, 175%, and 200%), the loss thresholds were were rarely hit.  We still had losing trades, with losses realized at expiration...but these losses were mostly less than our threshold value at expiration.

SPX Short Options Straddle Scatter Plot DIT versus P&L - 52 DTE - Risk:Reward 10% Exits
(click to enlarge)


IV Rank > 50% Filter

In this section we will look at the results of entering one trade for every monthly expiration only when the IVR of the SPX is greater than 50% ( >50% ).  Entering these trades at 52 DTE and utilizing our loss exits and 10% credit exits (described here) resulted in the equity curves below.

SPX Short Options Straddle Equity Curves - 52 DTE - IV Rank > 50 - Risk:Reward 10% Exits
(click to enlarge)

The trade metrics for these different exits are shown in the table below.  There are significantly fewer trades that meet the >50% IVR criteria.  This IVR criteria caused many of these variations to have negative total returns, and negative P&L per day readings...even though the win rates were nearly all 89%.

SPX Short Options Straddle Trade Metrics - 52 DTE - IV Rank > 50 - Risk:Reward 10% Exits
(click to enlarge)

The table below shows the distribution of returns in five-number summary format.

SPX Short Options Straddle 5 Number Summary - 52 DTE - IV Rank > 50 - Risk:Reward 10% Exits
(click to enlarge)


IV Rank < 50% Filter

In this section we will look at the results of entering one trade for every monthly expiration only when the IVRof the SPX is less than 50% ( <50% ).  Entering these trades at 52 DTE and utilizing our loss exits and 10% credit exits (described here) resulted in the equity curves below.

SPX Short Options Straddle Equity Curves - 52 DTE - IV Rank < 50 - Risk:Reward 10% Exits
(click to enlarge)

The trade metrics for these different exits are shown in the table below.  Using the lower IVR filter improved many of the metrics over the non-IVR filtered or IVR > 50% filtered variations.  The top variations in the table below had higher P&L per day readings, higher total P&L values, and higher win rates than the non-IVR filtered and IVR > 50% filtered variations...this is surprising and breaks the trend that we have seen up to this point.

SPX Short Options Straddle Trade Metrics - 52 DTE - IV Rank < 50 - Risk:Reward 10% Exits
(click to enlarge)

The table below shows the distribution of returns in five-number summary format.

SPX Short Options Straddle 5 Number Summary - 52 DTE - IV Rank < 50 - Risk:Reward 10% Exits
(click to enlarge)

In the next post we will look at the backtest results of 52 DTE ATM SPX short straddles using the same loss thresholds as above, but with profit taking occurring at 25% of the credit received.


Follow my blog by email, RSS feed or Twitter (@DTRTrading).  All options are available on the top of the right hand navigation column under the headings "Subscribe To RSS Feed", "Follow By Email", and "Twitter".

Saturday, October 3, 2015

SPX Straddle - 52 DTE - No Profit Management

This post looks at the results of selling a one-lot straddle on the S&P 500 Index (SPX), initiated at 52 days-to-expiration (DTE).  This is the first post of five on 52 DTE straddles, and will only look at loss exits...the other four posts will explore different profit exits on top of the loss exits in this post.  The results displayed in this post represent data from 824 individual trades entered by the automated backtester.

For background on the setup for the automated backtests, as well as the nomenclature used in the charts and tables below, please see the introductory article for this series: Option Straddle Series - P&L Exits.

In the trade metrics tables, some of the metrics rows have been highlighted to indicate values that are in the upper half of the readings.  One of the metrics to note is the average P&L per day in percentage terms (P&L % / Trade - Avg. P&L / Day).  This is a measure of the P&L per day normalized to the maximum initial portfolio margin (initial PM) required for that trade run...it tells us the effectiveness of theta with respect to our margin requirement.  Also note that the y-axis scale is the same in all of the 52 DTE equity curves.


No IV Rank Filter

In this section we will look at the results of entering one trade for every monthly expiration regardless of the implied volatility rank (IVR) of the SPX on the date of entry.  Entering these trades at 52 DTE and utilizing our loss exits (described here) resulted in the equity curves below.

SPX Short Options Straddle Equity Curves - 52 DTE - Risk:Reward Exits
(click to enlarge)

The trade metrics for these different exits are shown in the table below.  The win rates are pretty lousy.  This is due to the lack of profit based exits.  These equity curves look very similar to the other non-profit-managed trades at lower DTE.  As a reminder, these trades are either exited at expiration OR at the designated loss level.

SPX Short Options Straddle Trade Metrics - 52 DTE - Risk:Reward Exits
(click to enlarge)

The table below shows the distribution of returns in five-number summary format.  Hat-tip to tastytrade.

SPX Short Options Straddle 5 Number Summary - 52 DTE - Risk:Reward Exits
(click to enlarge)

Below are two images of scatter plots for selling 52 DTE ATM SPX straddles. The first image contains one scatter plot per strategy and shows P&L in percentage terms versus IVR for the SPX. The IVR was captured on the day each trade was initiated.  Higher IVR yields higher returns.


SPX Short Options Straddle Scatter Plot IV Rank versus P&L - 52 DTE - Risk:Reward Exits
(click to enlarge)

The next image shows P&L in percentage terms versus initial ATM IV. This ATM IV was captured on the day each trade was initiated.  Most of the trades are clustered in the 10 to 30 IV region.

SPX Short Options Straddle Scatter Plot IV versus P&L - 52 DTE - Risk:Reward Exits
(click to enlarge)

Neither of the scatter plot images give us any great insight with these straddle variations that only manage losses, not profits.


IV Rank > 50% Filter

In this section we will look at the results of entering one trade for every monthly expiration only when the IVR of the SPX is greater than 50% ( >50% ).  Entering these trades at 52 DTE and utilizing our loss exits (described here) resulted in the equity curves below.  The curves have long periods that are flat...these are times when no trades were taken due to the IVR being below the filter level.  This is a familiar pattern that we have seen with all of the trades using the IVR > 50% filter.

SPX Short Options Straddle Equity Curves - 52 DTE - IV Rank > 50 - Risk:Reward Exits
(click to enlarge)

The trade metrics for these different exits are shown in the table below.  These trades have better win rates and significantly better returns per day than the non-IVR filtered trades.  Less than 20% of the trades satisfied the IVR filter of  > 50%.

SPX Short Options Straddle Trade Metrics - 52 DTE - IV Rank > 50 - Risk:Reward Exits
(click to enlarge)

The table below shows the distribution of returns in five-number summary format.

SPX Short Options Straddle 5 Number Summary - 52 DTE - IV Rank > 50 - Risk:Reward Exits
(click to enlarge)


IV Rank < 50% Filter

In this section we will look at the results of entering one trade for every monthly expiration only when the IVR of the SPX is less than 50% ( <50% ).  Entering these trades at 52 DTE and utilizing our loss exits (described here) resulted in the equity curves below.

SPX Short Options Straddle Equity Curves - 52 DTE - IV Rank < 50 - Risk:Reward Exits
(click to enlarge)

The trade metrics for these different exits are shown in the table below.  These trades have lower win rates and lower total P&L numbers than the non-IVR and IVR > 50% filtered trades shown above.

SPX Short Options Straddle Trade Metrics - 52 DTE - IV Rank < 50 - Risk:Reward Exits
(click to enlarge)

The table below shows the distribution of returns in five-number summary format.

SPX Short Options Straddle 5 Number Summary - 52 DTE - IV Rank < 50 - Risk:Reward Exits
(click to enlarge)

We did not learn too much about how the 52 DTE SPX short straddles perform other than the IV rank filter had a positive impact on trade results.  We now have the baseline strategies to compare with the profit taking versions that we will review during the next several days.

In the next post we will look at the automated backtest results of 52 DTE SPX short straddles using the same loss thresholds as above, but with profit taking occurring at 10% of the credit received.


Follow my blog by email, RSS feed or Twitter (@DTRTrading).  All options are available on the top of the right hand navigation column under the headings "Subscribe To RSS Feed", "Follow By Email", and "Twitter"

Thursday, October 1, 2015

SPX Straddle - 45 DTE - Results Summary

Over the last five blog posts we looked at the backtest results for 4080 options straddles sold on the S&P 500 Index (SPX) at 45 days-to-expiration (DTE).  Eight different loss approaches were tested on these straddles.  On top of these eight loss approaches, tests were conducted with no profit taking, and profit taking at 10%, 25%, 35%, and 45% of the credit received.

For background information associated with the results in this post, please see the following posts:


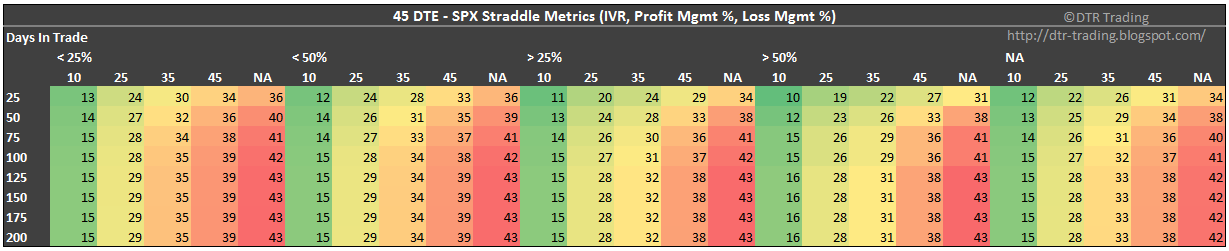
The results in this post are summarized in six heat map tables.  In these tables, each row corresponds to a different loss exit percentage.  For example, the first row (25) corresponds to the strategy variations where losses were taken at 25% of the credit received.  These rows have values from 25 to 200.  The columns are a little more complicated, and are grouped first by implied volatility rank (IVR) level, and then by profit exit percentage.  You can see that each IVR percentage level contains five columns (10, 25, 35, 45, and NA)...with each column representing a profit taking percentage.  For example, the first column lists all of the strategy variations where the IVR was less than 25% and profits were taken at 10% of the credit received.

The first table shows the average normalized P&L per day by IVR, profit taking percentage, and loss taking percentage. The highest daily returns are concentrated in the IVR > 50% columns, specifically the columns associated with profit taking at 25% and 35%.  The other area of strength was the IVR > 25% and profit taking at 35%.

45 DTE SPX Short Straddle Summary Normalized Percent P&L Per Day
(click to enlarge)

The second table shows the average P&L per trade by IVR, profit taking percentage, and loss taking percentage.  The area with the highest P&L per trade values was IVR > 50% and profit taking at 25%, 35%, and no profit management (NA).  Another area of strength was the IVR >25% and profit taking at 35%.

45 DTE SPX Short Straddle Summary Normalized Percent P&L Per Trade
(click to enlarge)

The third table shows the win percent / win rate by IVR, profit taking percentage, and loss taking percentage.  The highest win rates occur at lower profit taking levels...the lower the profit taking percentage, the higher the win rate for a given IVR grouping.  This highest individual win rates occur with an IVR > 50% and profit taking at 10%.  The most consistently high win rates are associated with an IVR < 25%, and profit taking at 10%.  At this level, six of the eight variations have win rates of 92%.

45 DTE SPX Short Straddle Summary Win Rate
(click to enlarge)

In the fourth table, we see the Sortino Ratio by IVR, profit taking percentage, and loss taking percentage.  The highest Sortino Ratios were associated with an IVR > 50%, profit taking at 10%, 25%, and 35%,  and high loss taking percentages (125% through 200%).

45 DTE SPX Short Straddle Summary Sortino Ratio
(click to enlarge)

The fifth table shows the profit factor by IVR, profit taking percentage, and loss taking percentage.  The largest profit factor values occurred in the same area containing high Sortino values.  This highest Sortinos were associated with an IVR > 50%, profit taking at 10%, 25%, and 35%,  and high loss taking percentages (125% through 200%).

45 DTE SPX Short Straddle Summary Profit Factor
(click to enlarge)

The last table shows the average days-in-trade (DIT) by IVR, profit taking percentage, and loss taking percentage.  What does this show...the quicker the profit taking, the shorter the time spent in a trade...obvious results here.  Limiting your losses to 25% of the credit received also took you out of the trades sooner.

45 DTE SPX Short Straddle Summary Days In Trade
(click to enlarge)

Which variation of the 45 DTE straddles is best?  As I've mentioned before, that depends on your risk tolerance.  If I was going to trade a 45 DTE ATM SPX straddle, I would gravitate towards the variation highlighted by Tastytrade...taking profits at 25% and taking losses at 125%.  Based on the data, I'm not sure I would apply the IVR > 50% filter though...causes you to miss out on too many profitable trades.  You can find links to all of my SPX straddle articles on the SPX Straddle Summary Page.

In the next post, we will start looking at the automated backtest results for the short straddle on the SPX at 52 DTE.


Follow my blog by email, RSS feed or Twitter (@DTRTrading).  All options are available on the top of the right hand navigation column under the headings "Subscribe To RSS Feed", "Follow By Email", and "Twitter".