The last article on RUT straddles (
here) was very popular, so I thought I'd write a similar post on SPX straddles. Recall that from September, 2015 through November, 2015 I reviewed the backtest results form 28,840 short options straddles on the S&P 500 Index (
SPX). You can read the summary articles from that SPX series
here and
here, and the introductory article for the straddle series
here.
In this post, I am going to show the P&L results for the SPX straddle in line-chart form similar to the last article. The data in the charts below is only for the non-IVR filtered trades. The first set of charts shows the P&L Per Day amounts, with each chart representing the results for trades started at the same days-to-expiration (DTE). Here are a few key points for each chart:
- Each colored line in a chart represents a particular profit taking percentage level in terms of the credit received
- The X-axis displays the loss taking percentage level in terms of the credit received
- The Y-axis displays the average normalized percent P&L per day
- The Y-axis scale is the same for all the P&L per day charts in this article
It's important to note that these returns are the average
normalized returns per day. This is important when comparing options strategies for the following reasons:
- Each data point in each of the seven P&L per day charts had different average trade durations. One data point may have had an average of 15 days-in-trade (DIT), while another may have had an average of 60 DIT. With most of these strategy variations, there were approximately 100 trades entered for each data point in the charts below. 100 times 15 is 1500 total DIT for a strategy, while 100 times 60 yields a total of 6000 DIT. The number of DIT obviously impacts the average P&L per day.
- When a straddle is entered at 38 DTE its initial portfolio margin (PM) requirement is going to be greater than say a straddle entered at 80 DTE. The difference in margin requirement can be nearly 20% greater in this example. This initial PM number must be taken into account in order to fairly compare P&L per day values...and has been in the charts below. Using dollar amounts instead of average normalized P&L per day would not necessarily take into account the different margin requirements for the different DTE variations.
Now, on to the charts...
38 DTE
 |
| (click to enlarge) |
Unlike the 38 DTE RUT straddles, the 38 DTE SPX straddles have a larger range in P&L per day numbers. There is a greater distance between each of the profit taking lines in the chart above, rather than the overlapping of the same lines for the RUT chart. Similar to the RUT, if you want to maximize your P&L per day, you should take profits at 10% and losses at 25%. These readings drop off as you increase your loss levels from 25%, to 50%, to 75%...there is a rebound in P&L per days readings at the two loss levels greater than 75%. Also note that most of the P&L per day readings on the 38 DTE SPX straddle are greater than the corresponding readings on the 38 DTE RUT straddle.
45 DTE
 |
| (click to enlarge) |
For the 45 DTE SPX straddle, the returns per day are maximized at the 125% and 150% loss taking levels. The 25% profit taking level had the greatest returns followed by the 35% profit taking level. Recall that for the 45 DTE RUT straddle, the top performer was the 10% profit taking level, with losses taken at 75%.
52 DTE
 |
| (click to enlarge) |
At 52 DTE, the P&L per day readings are fairly consistent for each of the profit taking levels...with a slight downward slope as the loss taking levels are increased. Taking losses larger than 25% doesn't pay off at 52 DTE. At the 25% loss taking level, P&L per day readings were maximized at the 45% profit taking level...although the 35% and 25% profit taking levels were not far behind. The 45% profit taking level was the clear winner for the 52 DTE RUT straddles as well...with the 25% loss taking level also being the clear winner for the RUT.
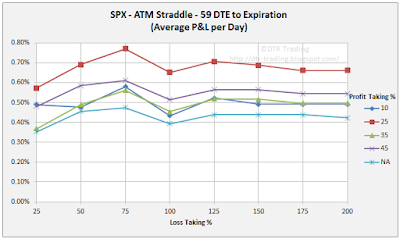
59 DTE
 |
| (click to enlarge) |
At 59 DTE, the SPX straddle profit taking lines look very similar to those for the RUT straddle...with P&L per day levels maximized with loss taking at 75%. To maximize your P&L per day at 59 DTE, take profits at 25% and losses at 75% for both the RUT and SPX straddles. Your returns per day drop after the 75% loss taking level, so no reason to let your losses get any larger than 75% for the 59 DTE straddle.
66 DTE
 |
| (click to enlarge) |
There's no reason to let your losses get any larger than 25% for the 66 DTE SPX straddle. Additionally, most of the profit taking lines are bunched together at the 25% loss taking level, so a lower profit taking % is appropriate. Taking profits at 25% and losses at 25% makes the most sense for the 66 DTE SPX straddle. The 66 DTE RUT straddle on the other hand had clear performance peaks at the 75% loss level.
73 DTE
 |
| (click to enlarge) |
At 73 DTE, taking losses at 75% has a clear benefit for most of the profit taking levels, except for the 10% profit taking level. The 35% and 45% profit taking levels were the winners with the loss taking at 75%. If you're taking losses at 25%, then the 10% profit taking level is superior. The 73 DTE RUT and SPX straddles both had the profit taking level of 10% showing the strongest performance at the 25% loss level. Considering both DIT and win rate, I would be inclined to trade the 73 DTE variation with profit taking at 10% and loss taking at 25%.
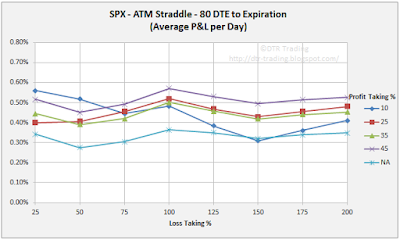
80 DTE
 |
| (click to enlarge) |
The 10% profit taking level outperformed the other profit taking levels at the 25% and 50% loss levels. The strongest overall performer was profit taking at 45% with a loss level of 100%.
----
The next set of charts contains the average
normalized P&L
per trade for the seven different DTE reviewed in my SPX straddle backtest series. The different initial PM requirements were used when calculating the P&L per trade numbers similar to how the PM was used in calculating the P&L per day numbers. Also, as above, the next seven charts use the same Y-axis scale.
38 DTE
 |
| (click to enlarge) |
At 38 DTE, the P&L per trade lines were fairly flat across loss taking levels, so not a huge benefit in carrying trades beyond the 25% loss taking level. The top performer took profits at 35% and losses at 25%. For a given profit taking level, the lowest per trade returns seemed to coincide with the 75% loss taking level.
45 DTE
 |
| (click to enlarge) |
At 45 DTE, per trade returns were maximized at the 125% loss taking level, regardless of the profit taking level. The top performer took profits at 35% and losses at 125%. The 25% profit taking level was a close second. We did not see this pattern on the 45 DTE RUT straddle.
52 DTE
 |
| (click to enlarge) |
There is a strong similarity between the RUT and SPX straddle charts at 52 DTE. With both, the 45% profit taking line had the greatest returns per trade. For the RUT, you should limit your largest loss to 50%, while with the SPX the limit should be at the 75% loss level.
59 DTE
 |
| (click to enlarge) |
At 59 DTE, P&L per trade was maximized at the 75% loss taking level. The greatest returns again occurred with the 45% profit taking level, with the highest per trade return being just under 30%. The RUT and SPX straddle charts look very similar at 59 DTE.
66 DTE
 |
| (click to enlarge) |
At 66 DTE, you can detect a slight upward drift in most of the profit taking lines in the chart. There is a clear transition at the 75% loss taking level, but it is hard to ignore the solid returns at the 25% loss taking level.
73 DTE
 |
| (click to enlarge) |
At 73 DTE, there is a huge increase in P&L per trade by letting losses run to 75%...but no real benefit in letting your losses exceed this amount. The top performer took profits at 45% and losses at 125%...although the 125% loss level did not deliver returns that much greater than the 75% loss taking level.
80 DTE
 |
| (click to enlarge) |
At 80 DTE, the P&L per trade was maximized at the 100% loss taking level for all of the profit taking lines except for the 10% profit taking line. The 10% profit taking level showed maximum per trade returns at the 50% loss taking level, although the returns at the 50% loss taking level are not much greater than at the 25% loss taking level.
For most of the charts, the 10% profit taking level and the 25% loss taking level almost always yielded a return of approximately 5% on the PM requirement...and the PM requirement becomes smaller as we move out in DTE. We noticed this same pattern with the RUT straddles. Additionally, at 73 DTE and 80 DTE the 10% profit taking level and 25% loss taking level yielded returns of approximately 10% per trade.
As we noted for the RUT straddles, 5% at 38 DTE is going to be a greater dollar amount than 5% at 80 DTE. I continue to think that the data around the 10% profit taking level is very interesting.
When we consider profit taking targets we need to consider how these targets impact DIT. Here are a few approximations that seem to hold with both the SPX and RUT straddles:
- The 10% profit taking level will have your DIT at approximately 30% of DTE
- The 25% profit taking level will have your DIT at approximately 60% of DTE
- The 35% profit taking level will have your DIT at approximately 70% of DTE
- The 45% profit taking level will have your DIT at approximately 80% of DTE
Don't forget, that as the profit taking level is increased, the win rate drops. See my
SPX Straddle Summary Page for links to all of the articles in the series. Lastly, over the next several days I will tweet (
@DTRTrading) win rate line-charts and DIT line-charts, similar to those above.
Follow my blog by email, RSS feed or Twitter (@DTRTrading). All options are available on the top of the right hand navigation column under the headings "Subscribe To RSS Feed", "Follow By Email", and "Twitter".


