There are six groupings of charts below, with each grouping containing 12 charts. Each row corresponds to a short delta (row 1 = 8 delta, row 2 = 12 delta, row 3 = 16 delta, row 4 = 20 delta), and each column corresponds to an IC wing width (column 1 = 25 points, column 2 = 50 points, column 3 = 75 points).
Each of the charts contains data for the 12 exits for each of the three primary IC structures (standard balanced - ST, extra long put - EL, delta neutral - DN).
All of the charts are structured similarly:
- Each colored line in a chart represents a particular type of IC structure:
- Blue lines are for standard balanced ICs (ST)
- Red lines are for extra long put ICs (EL)
- Green lines are for delta neutral ICs (DN)
- The lines styles are associated with a particular profit taking approach:
- Solid lines represent profit taking at 50% of the credit received
- Dashed lines represent profit taking at 75% of the credit received
- Dotted lines represent closing the trade at 2 DTE with no profit taking target (NA)
- The X-axis displays the loss taking percentage level in terms of the credit received:
- 100%, 200%, 300%, and no loss taking level / closing at 2 DTE (NA)
Normalized P&L per Day
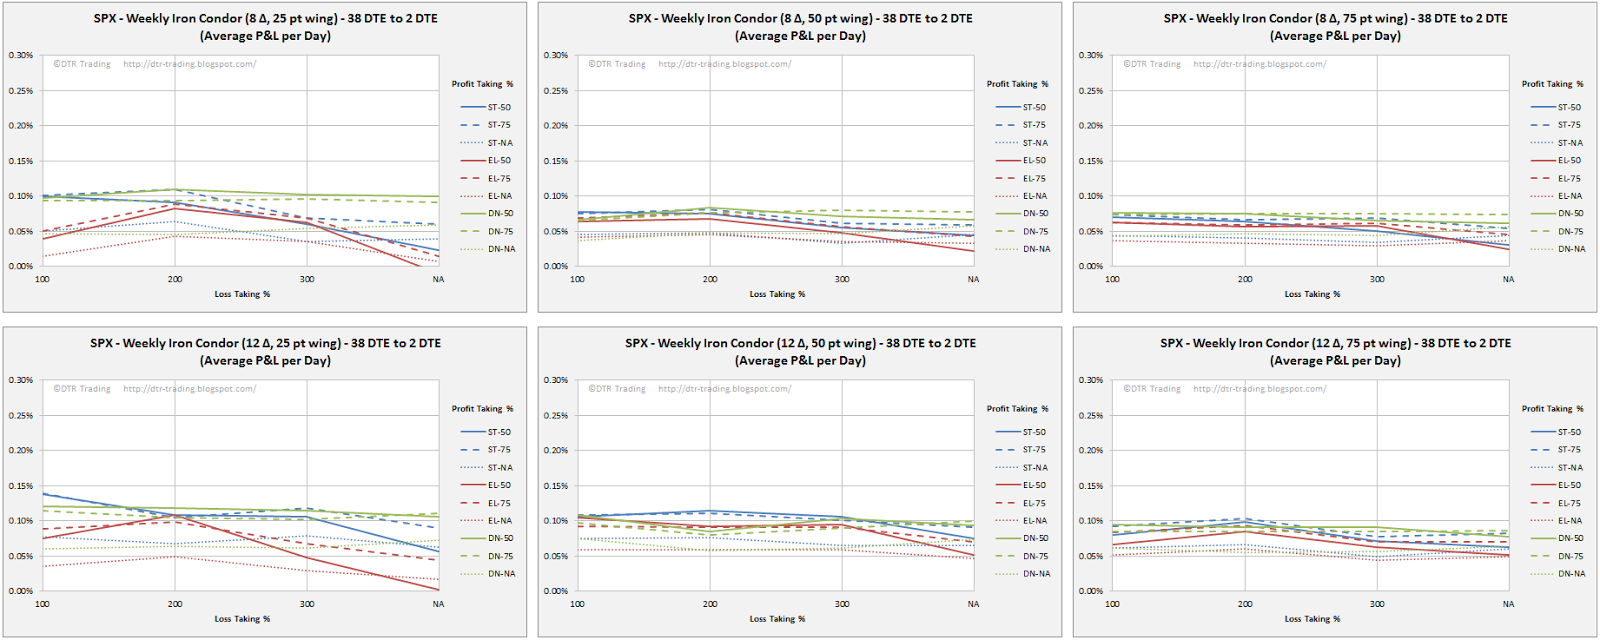
This first set of charts shows normalized P&L Per Day percentages. A couple of notes on these charts:
- The Y-axis scale is the same for all the P&L per day charts in this blog post
- The Y-axis displays the average normalized percent P&L per day
- Each of the 432 test runs is represented in the 12 charts below, and each test run had a different average days-in-trade (DIT). The number DIT obviously impacts the average P&L per day
- The max risk for a 25 point 8 delta IC will be approximately half the max risk for a 50 point 8 delta IC. The P&L per day values are expressed as a percentage of the max risk for that test run...this is necessary in order to fairly compare the returns of each of the different wing widths
- There is more variability in P&L per day readings in the 25 point wing width ICs
- As the delta of the short strikes increases, the variability in the P&L per day readings increases
- The largest reading was 0.18% and was associated with the ST (100:50), 50 point wings, 20 delta
- The next best reading was 0.17% and was associated with three test runs:
- ST (100:50), 25 point wings, 20 delta
- ST (100:75), 25 point wings, 16 delta
- DN(100:50), 25 point wings, 20 delta
 |
| (click to enlarge) |
Normalized P&L per Trade
The normalized P&L per trade charts are organized in the same way as the normalized P&L per day charts. Also note that these returns are expressed as a percentage of the max risk for a particular test run. There were 432 test runs, with each test run including 200+ trades. In a test run, the $ returns for each of these trades varied slightly, as well as the $ max risk for each of these trades. The $ returns were averaged, and this $ average was divided by the largest $ max risk for all of the 200+ trades in that run. This is the normalized P&L for that test run...with all 432 of these data points displayed in the 12 charts below.
We see the following in the data:
- We can see that the variability in normalized P&L per trade again increases as the delta of the short strike increases, and decreases with increasing wing width.
- The largest normalized P&L per trade was 4.3% for the ST (200:75), 25 point wings, 16 delta
- The top four P&L per trade variations were all associated with profit taking at 75%, wing widths of 25 points, and short strike deltas of 16
- The top P&L per day variations came in the following positions in terms of P&L per trade:
- ST (100:50), 50 point wings, 20 delta came in 7th place -> 3.4%
- ST (100:50), 25 point wings, 20 delta came in 11th place -> 3.4%
- ST (100:75), 25 point wings, 16 delta came in 2nd place -> 4.1%
- DN(100:50), 25 point wings, 20 delta came in 5th place -> 3.5%

 |
| (click to enlarge) |
Win Rate
The chart structure should be familiar to you by now, so I'll not review the chart layouts. The win rate trends are clear:
- Win rates tend to increase as wing widths increase
- Win rates tend to increase as the delta of the short strike decreases
- The top win rate was 92%, and was associated with these five strategies:
- DN (NA:50), wing width 75, 8 delta
- DN (NA:50), wing width 50, 8 delta
- ST (NA:50), wing width 50, 8 delta
- ST (NA:50), wing width 75, 8 delta
- DN (NA:50), wing width 25, 8 delta
- The top 10 strategies all had win rates of 91% or better...and all 10 had two variables in common...they took profits at 50%, and none of them used loss exits (they exited at 2 DTE). 8 of these 10 also had short strike deltas of 8.

 |
| (click to enlarge) |
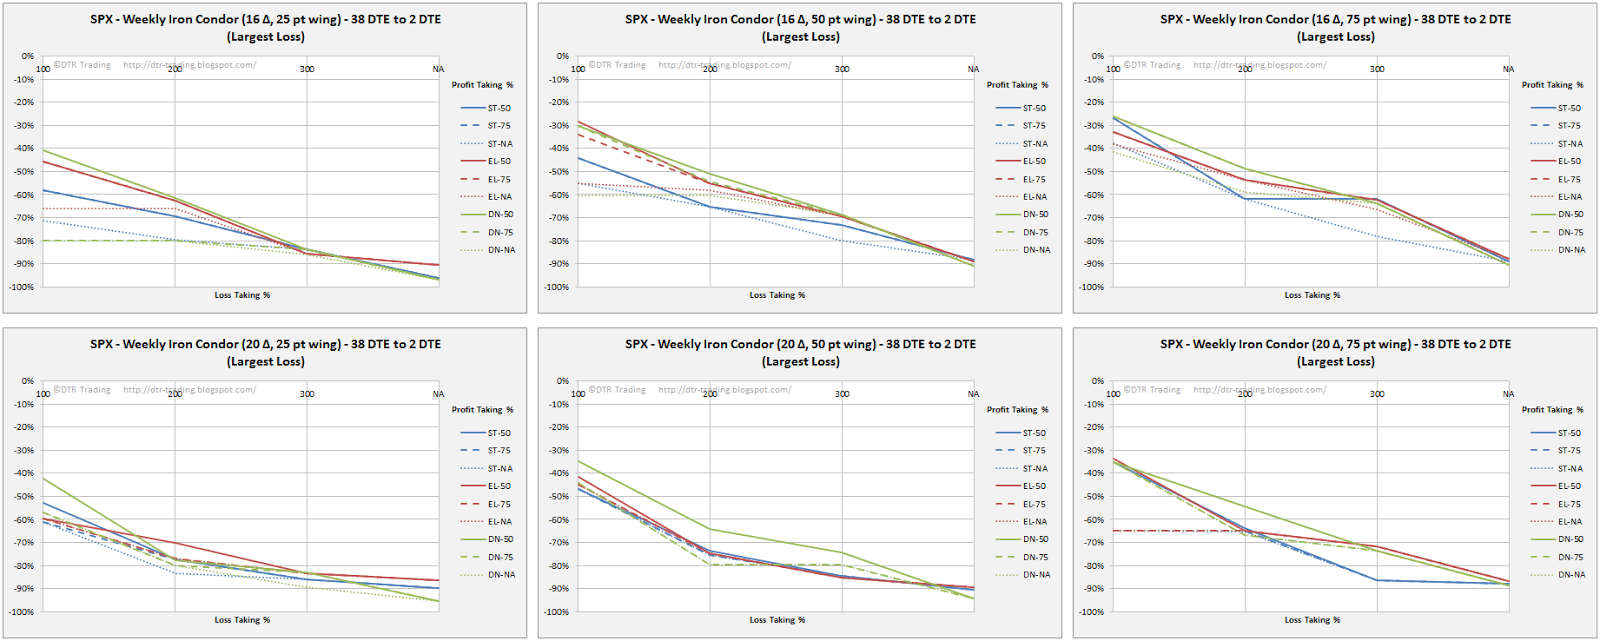
Largest Loss
The next charts show the normalized largest loss for each of the test runs These largest losses are expressed as a percentage of the max defined risk number for all of the 200+ trades in a test run. Here are the trends:
- The largest loss percentage increases with increasing short strike delta
- The largest loss percentage increases with increasing loss taking level...surprise! :)
- The top 24 largest losses all occurred with strategies with 25 point wing widths, and had losses of 95% or greater
- The top 4 smallest losses all occurred with strategies with 75 point wing widths and 8 delta short strikes:
- DN (100:50), 75 point wings, 8 delta -> 15% loss
- DN (100:75), 75 point wings, 8 delta -> 15% loss
- ST (100:50), 75 point wings, 8 delta ->15% loss
- ST (100:75), 75 point wings, 8 delta -> 15% loss

 |
| (click to enlarge) |
Profit Factor
The best 15 profit factors were associated with delta neutral trades with 8 delta short strikes. The top performers were:
- DN (NA:NA), 75 point wings, 8 delta -> 2.0
- DN (NA:75), 50 point wings, 8 delta -> 1.9
- DN (NA:75), 75 point wings, 8 delta -> 1.9
- DN (NA:NA), 50 point wings, 8 delta -> 1.9
- DN (300:75), 50 point wings, 8 delta -> 1.9

 |
| (click to enlarge) |
Average DIT For Winning Trades
This metric was derived by averaging all of the DIT for all of the winning trades in test run. If you are basing your IC trading on one of the 432 variations in my backtesting, you'll want to keep an eye on these DIT numbers. Adding a DIT exit to your profit and loss exits is worth considering.
Here are a few trends:
- The larger the delta of your short strikes the longer you'll need to stay in your trades
- The larger your profit taking level, the longer you'll need to stay in your trade...surprise! :)
- The 50% profit taking level should have you out of the trade in less than 20 days for a 38 DTE IC
- The smallest winning trade DITs were associated with 8 delta short strikes, profit taking at 50%, and loss taking at 100%...the structure type (ST, EL, DN) did not matter as seen in the charts

 |
| (click to enlarge) |
A part two to this article will follow some time next week.
Follow my blog by email, RSS feed or Twitter (@DTRTrading). All options are available on the top of the right hand navigation column under the headings "Subscribe To RSS Feed", "Follow By Email", and "Twitter".