CustomMenu

Showing posts with label Strangle. Show all posts

Monday, May 20, 2019

SPX Strangle - 2019 Q1 Review

We looked at the performance of a few of the better performing SPX strangles in a prior article (here). In this post, we'll revisit those strangle variations and see how they performed in the first quarter of this year. Their performance will be compared to their historical performance from January 2007 through December 2018.

These are the variations we'll review:
  1. 59 DTE - 16 Delta Short Strikes (100:50) / 2 DTE - exit if the trade has a loss of 100% of its initial credit OR if the trade has a profit of 50% of its initial credit OR at 2 DTE.
  2. 59 DTE - 16 Delta Short Strikes (100:50) / 29 DTE - exit if the trade has a loss of 100% of its initial credit OR if the trade has a profit of 50% of its initial credit OR at 2 DTE.
  3. 59 DTE - 16 Delta Short Strikes (200:50) / 2 DTE - exit if the trade has a loss of 200% of its initial credit OR if the trade has a profit of 50% of its initial credit OR at 2 DTE.
  4. 59 DTE - 16 Delta Short Strikes (200:50) / 29 DTE - exit if the trade has a loss of 200% of its initial credit OR if the trade has a profit of 50% of its initial credit OR at 2 DTE.
  5. 45 DTE - 16 Delta Short Strikes (200:50) / 2 DTE - exit if the trade has a loss of 200% of its initial credit OR if the trade has a profit of 50% of its initial credit OR at 2 DTE.
  6. 45 DTE - 16 Delta Short Strikes (200:50) / 22 DTE - exit if the trade has a loss of 200% of its initial credit OR if the trade has a profit of 50% of its initial credit OR at 2 DTE.

The 45 DTE variations follow the entry and exit criteria popularized by TastyTrade here:

For each variation, I show one table and two charts. The table shows the percent return on portfolio margin. The first chart shows these same return numbers, but compared to their historical returns (max, min, average, and quartiles).The second chart shows the DIT numbers for each variation compared to the average for this variation.

Let's get right to the results for each of these variations.


59 DTE - 16 Delta Short Strikes (100:50) / 2 DTE

The average monthly return for Q1 was -12%, versus the 2007 to 2018 monthly average of +3%. Total return for the quarter was -37%. Pretty bad return numbers. The average DIT for Q1 was 23, which was below the 2007 to 2018 average of 27 DIT.

(click to enlarge)

(click to enlarge)

(click to enlarge)


59 DTE - 16 Delta Short Strikes (100:50) / 29 DTE

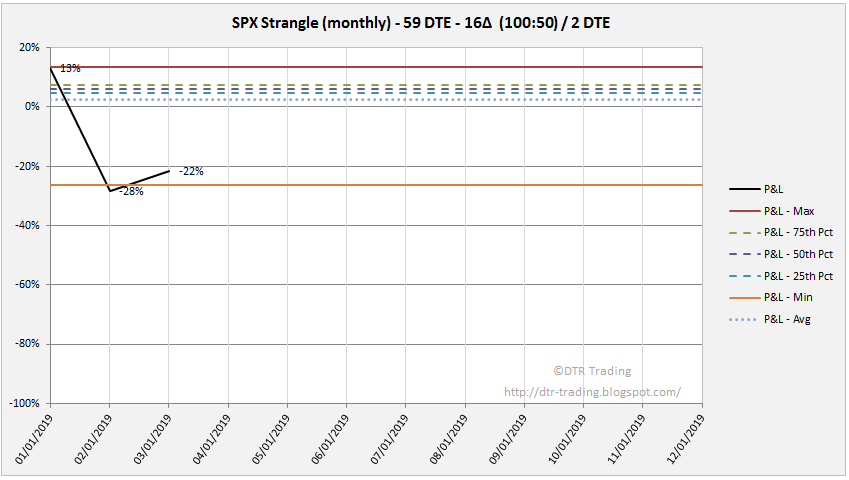
The average monthly return for Q1 was -7%, versus the 2007 to 2018 monthly average of +2%. Total return for the quarter was -22%. Again, pretty bad return numbers. The average DIT for Q1 was 20, which was below the 2007 to 2018 average of 24 DIT.

(click to enlarge)

(click to enlarge)

(click to enlarge)


59 DTE - 16 Delta Short Strikes (200:50) / 2 DTE

The average monthly return for Q1 was +1%, versus the 2007 to 2018 monthly average of +3%. Total return for the quarter was +3%. Pretty bad return numbers, but at least we have positive returns overall. The average DIT for Q1 was 32, which was above the 2007 to 2018 average of 29 DIT.

(click to enlarge)

(click to enlarge)

(click to enlarge)


59 DTE - 16 Delta Short Strikes (200:50) / 29 DTE

The average monthly return for Q1 was +7%, versus the 2007 to 2018 monthly average of +3%. Total return for the quarter was +20%. Finally some good return numbers. The average DIT for Q1 was 23, which was below the 2007 to 2018 average of 25 DIT.

(click to enlarge)

(click to enlarge)

(click to enlarge)


45 DTE - 16 Delta Short Strikes (200:50) / 2 DTE

The average monthly return for Q1 was -26%, versus the 2007 to 2018 monthly average of +1%. Total return for the quarter was -73%. Horrible return numbers for the quarter. The average DIT for Q1 was 32, which was above the 2007 to 2018 average of 23 DIT.

(click to enlarge)

(click to enlarge)

(click to enlarge)


45 DTE - 16 Delta Short Strikes (200:50) / 22 DTE

The average monthly return for Q1 was -19%, versus the 2007 to 2018 monthly average of +1%. Total return for the quarter was -57%. Again, horrible return numbers for the 45 DTE variations. The average DIT for Q1 was 21, which was above the 2007 to 2018 average of 19 DIT.

(click to enlarge)

(click to enlarge)

(click to enlarge)

In the next post, we'll review the Q1 returns for the SPX straddle variations.


If you don't want to miss my new blog posts, follow my blog either by email, RSS feed or by Twitter.  All options are free, and are available on the top of the right hand navigation column under the headings "Subscribe To RSS Feed", "Follow By Email", and "Twitter".  I follow blogs by RSS using Feedly, but any RSS reader will work.

Wednesday, April 17, 2019

SPX Strangle - 2018 Review

I've been a little curious how the SPX strangle has been performing since I last analyzed its results back in 2015 (here). For this article, we'll just look at the following variations and how they performed from January 2007 through December 2018:

  1. 59 DTE - 16 Delta Short Strikes (100:50) / 2 DTE - exit if the trade has a loss of 100% of its initial credit OR if the trade has a profit of 50% of its initial credit OR at 2 DTE.
  2. 59 DTE - 16 Delta Short Strikes (100:50) / 29 DTE - exit if the trade has a loss of 100% of its initial credit OR if the trade has a profit of 50% of its initial credit OR at 29 DTE.
  3. 59 DTE - 16 Delta Short Strikes (200:50) / 2 DTE - exit if the trade has a loss of 200% of its initial credit OR if the trade has a profit of 50% of its initial credit OR at 2 DTE.
  4. 59 DTE - 16 Delta Short Strikes (200:50) / 29 DTE - exit if the trade has a loss of 200% of its initial credit OR if the trade has a profit of 50% of its initial credit OR at 29 DTE.
  5. 45 DTE - 16 Delta Short Strikes (200:50) / 2 DTE - exit if the trade has a loss of 200% of its initial credit OR if the trade has a profit of 50% of its initial credit OR at 2 DTE.
  6. 45 DTE - 16 Delta Short Strikes (200:50) / 22 DTE - exit if the trade has a loss of 200% of its initial credit OR if the trade has a profit of 50% of its initial credit OR at 22 DTE.

For these backtests, I used the Portfolio Margin (PM) requirements for strangles from TD/ThinkOrSwim from last weekend (13-Apr-2019). These numbers were $16K for 59 DTE strangles, and $19K for 45 DTE strangles. The performance of these variations in 2015 is shown in the tables below.

(click to enlarge)

(click to enlarge)

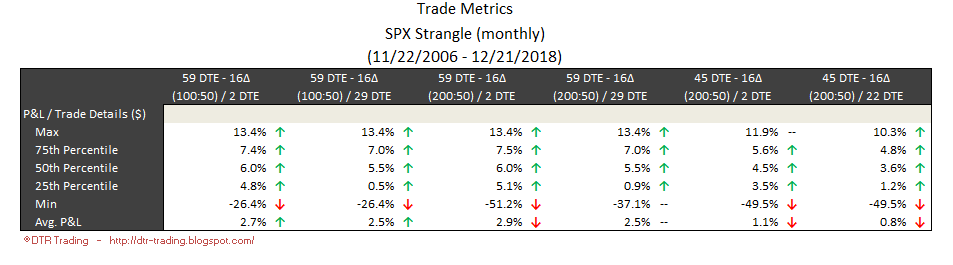
Now let's look at the metrics again, but adding in the results through December 2018. The tables below show the same metrics, but highlight which metrics have increased, which metrics have decreased, and which metric are unchanged.

(click to enlarge)

(click to enlarge)

The return metrics (top table) have generally improved across all variations. The variation taking losses at 100% of the credit received had improved metrics in the second table.

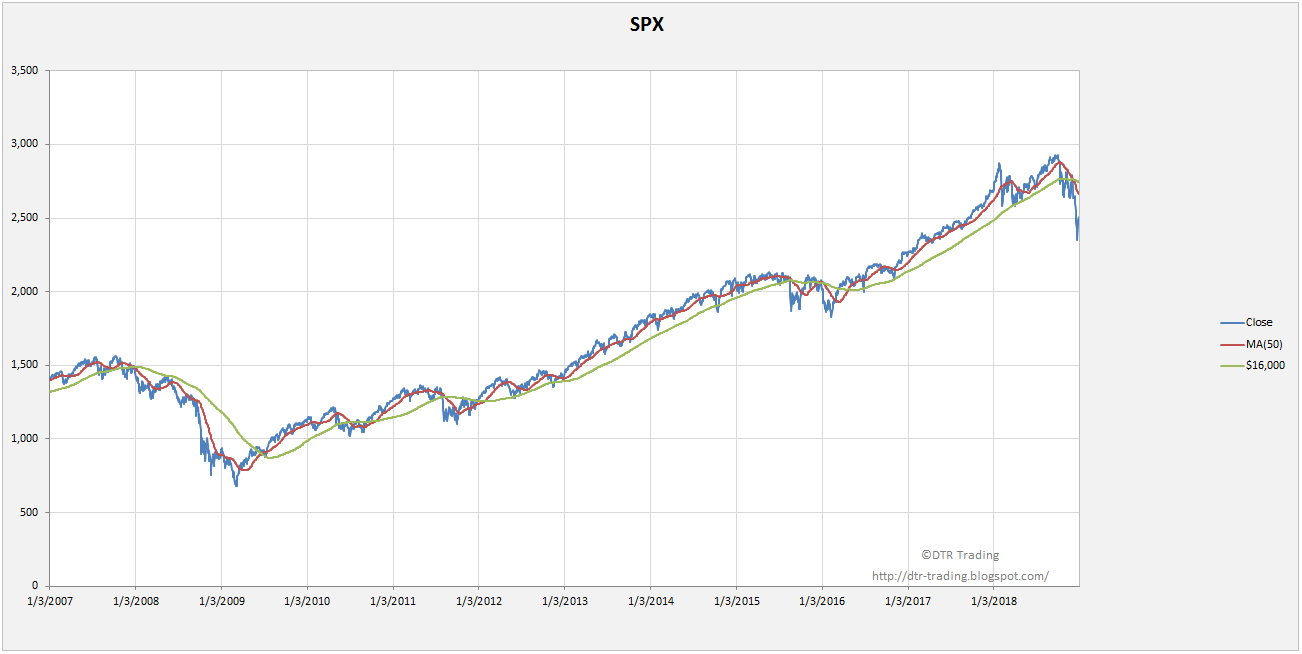
The corresponding equity curves for these variations are shown in the chart below, along with the chart of the SPX during this same time period.

(click to enlarge)

(click to enlarge)

In case you're interested, I've included the updated return percentages for each variation below.

(click to enlarge)


(click to enlarge)

(click to enlarge)

(click to enlarge)

(click to enlarge)

(click to enlarge)


If you don't want to miss my new blog posts, follow my blog either by email, RSS feed or by Twitter.  All options are free, and are available on the top of the right hand navigation column under the headings "Subscribe To RSS Feed", "Follow By Email", and "Twitter".  I follow blogs by RSS using Feedly, but any RSS reader will work.

Wednesday, September 2, 2015

RUT Strangle - Backtest Results Summary

Over the last six blog posts we looked at the backtest results for over 13,700 options strangles sold on the Russell 2000 Index (RUT).  Eight different exit approaches were tested on these strangles, including:

  1. Strangle (100:50) - exit if the trade has a loss of 100% of its initial credit OR if the trade has a profit of 50% of its initial credit OR at Expiration.
  2. Strangle (200:50) - exit if the trade has a loss of 200% of its initial credit OR if the trade has a profit of 50% of its initial credit OR at Expiration.
  3. Strangle (300:50) - exit if the trade has a loss of 300% of its initial credit OR if the trade has a profit of 50% of its initial credit OR at Expiration.
  4. Strangle (NA:50) - exit if the trade has a profit of 50% of its initial credit OR at Expiration.
  5. Strangle-ExOut (NA:50) - exit if the moves beyond either short strike OR if the trade has a profit of 50% of its initial credit OR at Expiration.
  6. Strangle-ExOut (200:50) - exit if the moves beyond either short strike OR if the trade has a loss of 200% of its initial credit OR if the trade has a profit of 50% of its initial credit OR at Expiration.
  7. Strangle (200:25) - exit if the trade has a loss of 200% of its initial credit OR if the trade has a profit of 25% of its initial credit OR at Expiration.
  8. Strangle (200:75) - exit if the trade has a loss of 200% of its initial credit OR if the trade has a profit of 75% of its initial credit OR at Expiration.

We applied these exits to strangles constructed with different delta short strikes (4, 6, and 8 delta) at different days to expiration (45, 52, 59, 66, 73, and 80).  For background information associated with the results in this post, please visit the following posts:


To get a qualitative sense of the performance of these different delta/DTE combinations, we'll first review their equity curves.  Recall that the y-axis scale is the same for all of the equity curves (-600% to 1000%).  The thumbnails are small, but larger images are displayed when you click on them.

RUT Short Strangle Curves RUT 45 to 59 DTE 4, 6, and 8 Delta Risk:Reward Exits
RUT Short Strangle Curves RUT 66 to 80 DTE 4, 6, and 8 Delta Risk:Reward Exits
(click to enlarge)

Now let's move on to the metrics.  Before we do, let's review the table format that I am using to display these results. Each set of metrics is displayed as a pair of heat-map tables.  The first table in the pair groups columns by DTE first, followed by short strike delta.  The second table in the pair displays the same metrics, but groups columns by short strike delta first, followed by DTE.  The first column of each table lists the strategy variation, including the exit used. This column uses the strategy description nomenclature that I used in the last several posts.  Hopefully this makes sense, but feel free to submit a comment on this post if you'd like me to clarify the format / nomenclature further.

The image below shows the average normalized P&L per day by delta, DTE, and strategy. The highest daily returns are concentrated at the 8 delta short strikes at the higher DTE values.  This can be seen by the high concentration of green on the right side of the second table of the pair of tables.  Additionally, there are clusters of performance for several of the exit approaches...two of the strongest are the 200:25 and 300:50, with strength across several delta and DTE combinations.

RUT Short Strangle Summary Normalized Percent P&L Per Day
(click to enlarge)

The second pair of tables shows the average P&L per trade by delta, DTE, and strategy.  Again, the highest overall returns occur in the 8 delta region of the tables.  As with the SPX strangles, the 200:75 and 300:50 have broader out-performance across delta and DTE.

RUT Short Strangle Summary Normalized Percent P&L Per Trade
(click to enlarge)

The next image shows the win percent / win rate by delta, DTE, and strategy.  The highest win rates are more highly correlated to exit approach than either delta or DTE.  The NA:50 and ExOut NA:50 strategies have the highest win rates...many in the high 90% range.  This is the same trend that was present in the SPX strangles.  Strangles are similar to iron condors in that the greater your tolerance for unrealized losses, the higher your win rate.  Another point to note, a common sense point,  the more profit you attempt to take out of the trade, the lower your win rate.  You can see this when comparing the 200:25, 200:50, and 200:75.  Lastly, the 200:25 and 300:50 variations had higher win rates than the corresponding SPX strangles.

RUT Short Strangle Summary Win Rate
(click to enlarge)

In the fourth pair of tables, we see the Sortino Ratio by delta, DTE, and strategy.  Unsurprisingly, the highest Sortino's were associated with the lowest risk:reward exit...the 100:50.  There were a couple other clusters of high Sortino's between 59 and 73 DTE with the 200:50, 200:75 and 300:50 exits.  We noticed a similar trend with the SPX strangles.

RUT Short Strangle Summary Sortino Ratio
(click to enlarge)

The fifth, and last, heat-map image shows the profit factor by delta, DTE and strategy.  Some of the highest profit factors occurred in regions with high Sortino values.

RUT Short Strangle Summary Profit Factor
(click to enlarge)

Besides the 13,700+ trades used to generate the results above, I backtested an additional 41,000+ RUT strangle strategy variations (with other exits and deltas).  In total, I backtested more than 55,000 RUT strangle trades in all.  I posted the results from these additional trades on Twitter (@DTRTrading).  You can find links to all of these tweets/posts on the RUT Strangle Summary Page.

Looking at the trade metrics for all of the 55,000+ RUT short strangle trades yields additional patterns.  The table below shows the top 20 strategies with the highest normalized average P&L per trade.  Similar to the SPX strangles, the 73 and 80 DTE, 16 and 20 delta variations took most of the top spots.  The top six spots were managed at either 200:75 or 300:75.  Out of the top 20, seventeen were managed at 75% profit.

RUT Short Strangle - Top 20 Exits - Normalized Percent P&L Per Trade
(click to enlarge)

The table below lists the top 20 strategies ordered by their win rate.  Only the first strategy in the top 20 utilized a loss exit.  All of the top 20 took profits at 25%.  Smaller deltas were also a trait of the high win rate trades.  This makes sense, since your short strikes are the furthest away from ATM, and profits are taken sooner.

RUT Short Strangle - Top 20 Exits - Summary Win Rate
(click to enlarge)

I'm still considering what I will test next...so it might be a week or so before my next post.


Also, please share my blog with other options traders, as this should reduce the plagiarism of my work...which I've heard has been increasing during the last several months.


Follow my blog by email, RSS feed or Twitter.  All options are free, and are available on the top of the right hand navigation column under the headings "Subscribe To RSS Feed", "Follow By Email", and "Twitter".  I follow blogs by RSS using Feedly, but any RSS reader will work.

Thursday, August 27, 2015

RUT Strangle - High Loss Threshold - 80 DTE

This post reviews the backtest results of selling one-lot options strangles on the Russell 2000 Index (RUT), initiated at 80 days-to-expiration (DTE).  The results in this post were derived from 2200 individual trades entered by the backtester.  The results are grouped by the delta of the short strikes.  For example, a 4 delta strangle is constructed by selling a -4 delta put, and selling a +4 delta call.

For background on the setup for the backtests, as well as the nomenclature used in the charts and tables below, please see the introductory article for this series: Option Strangle Series - Higher Loss Thresholds

In the trade metrics tables, I have highlighted the rows to indicate values that are in the upper half of the readings.  One of the metrics to note is the average P&L per day in percentage terms (Trade Details (%) - Avg. P&L / Day).  This is a measure of the P&L per day normalized to the maximum initial portfolio margin (initial PM) required for that trade run...it tells us the effectiveness of theta with respect to our margin requirement.

Also note, that all of the blog posts for the RUT strangle series have equity curves with identical y-axis scales, unless otherwise noted.

4 Delta Short Strikes
Short Options Strangle Equity Curves RUT 80 DTE 4 Delta Risk:Reward Exits
(click to enlarge)
Short Options Strangle Trade Metrics RUT 80 DTE 4 Delta Risk:Reward Exits
(click to enlarge)
For the 80 DTE, 4 delta RUT short strangles, the top exit approaches indicated by the metrics were the: 200:75, and 200:50 / ExOut 200:50 variations.  The highest return occurred with the 200:75 exit.


6 Delta Short Strikes
Short Options Strangle Equity Curves RUT 80 DTE 6 Delta Risk:Reward Exits
(click to enlarge)
Short Options Strangle Trade Metrics RUT 80 DTE 6 Delta Risk:Reward Exits
(click to enlarge)
For the 80 DTE, 6 delta RUT short strangles, the top exit approaches indicated by the metrics were again the: 200:75, ExOut 200:50, and 200:50 variations.  The highest return again occurred with the 200:75 exit.


8 Delta Short Strikes
Short Options Strangle Equity Curves RUT 80 DTE 8 Delta Risk:Reward Exits
(click to enlarge)
Short Options Strangle Trade Metrics RUT 80 DTE 8 Delta Risk:Reward Exits
(click to enlarge)
For the 80 DTE, 8 delta RUT short strangles, the top exit approaches indicated by the metrics were the: 200:75, 200:50, and ExOut 200:50 variations.  The highest return again occurred with the 200:75 exit.

With the 80 DTE tests, the highest average P&L per day readings occurred with the 8 delta short strike variations, with an average of 0.17% per day.  The highest overall P&L per day reading was 0.21% per day and was tied between the 6 delta 200:75 variation and the 8 delta 200:50 variation.

Below are three images of scatter plots for the 80 DTE 8 delta short strangles.  The first image contains one scatter plot per strategy and shows P&L in dollar terms versus days-in-trade (DIT).  There is one visible trend in this set of scatter plots: the largest losses tend to occur at lower DIT values for trades with a loss based exit.  This is consistent across different DTE entries.

Short Options Strangle DIT versus P&L for RUT 80 DTE 8 Delta Risk:Reward Exits
(click to enlarge)

The second image shows P&L in terms of the initial at-the-money (ATM) implied volatility (IV) of the RUT.  This ATM IV was captured on the day each trade was initiated.  In general, there is a trend that higher P&L numbers are associated with higher ATM IV numbers...similar to the 45 DTE scatter plots.  This trend is also consistent across different DTE entries.

Short Options Strangle IV versus P&L for RUT 80 DTE 8 Delta Risk:Reward Exits
(click to enlarge)

The last image shows P&L in terms of the initial IV Rank for the RUT.  The IV Rank was captured on the day each trade was initiated.  In general, there is a trend that higher IV rank is associated with higher P&L.  Also, if you trade only when IV rank is higher, you can eliminate many losing trades.  Both of these trends were visible in the 45 DTE scatter plots as well.  This is also consistent across different DTE entries.

Short Options Strangle IV Rank versus P&L for RUT 80 DTE 8 Delta Risk:Reward Exits
(click to enlarge)

In the next post I will summarize the results for the RUT short strangle strategy.

FYI, I am posting results for higher delta strangles (at the same DTEs), as well as 8 additional exits on my Twitter feed...I am not posting these additional results to the blog.

As always, feel free to use any of the images/information on my blog...just be sure to reference this blog when sharing the information with others.


Follow my blog by email, RSS feed or Twitter.  All options are free, and are available on the top of the right hand navigation column under the headings "Subscribe To RSS Feed", "Follow By Email", and "Twitter".  I follow blogs by RSS using Feedly, but any RSS reader will work.

Monday, August 24, 2015

RUT Strangle - High Loss Threshold - 73 DTE

This post reviews the backtest results of selling one-lot options strangles on the Russell 2000 Index (RUT), initiated at 73 days-to-expiration (DTE).  The results in this post were derived from 2312 individual trades entered by the backtester.  The results are grouped by the delta of the short strikes.  For example, a 4 delta strangle is constructed by selling a -4 delta put, and selling a +4 delta call.

For background on the setup for the backtests, as well as the nomenclature used in the charts and tables below, please see the introductory article for this series: Option Strangle Series - Higher Loss Thresholds

In the trade metrics tables, I have highlighted the rows to indicate values that are in the upper half of the readings.  One of the metrics to note is the average P&L per day in percentage terms (Trade Details (%) - Avg. P&L / Day).  This is a measure of the P&L per day normalized to the maximum initial portfolio margin (initial PM) required for that trade run...it tells us the effectiveness of theta with respect to our margin requirement.

Also note, that all of the blog posts for the RUT strangle series have equity curves with identical y-axis scales, unless otherwise noted.

4 Delta Short Strikes
Short Options Strangle Equity Curves RUT 73 DTE 4 Delta Risk:Reward Exits
(click to enlarge)
Short Options Strangle Trade Metrics RUT 73 DTE 4 Delta Risk:Reward Exits
(click to enlarge)
For the 73 DTE, 4 delta RUT short strangles, the top exit approaches indicated by the metrics were the: 300:50, 200:50 / ExOut 200:50, and 200:75 variations.  The highest return occurred with the 200:75 exit, but it's average P&L % / day number was lower than others.


6 Delta Short Strikes
Short Options Strangle Equity Curves RUT 73 DTE 6 Delta Risk:Reward Exits
(click to enlarge)
Short Options Strangle Trade Metrics RUT 73 DTE 6 Delta Risk:Reward Exits
(click to enlarge)
For the 73 DTE, 6 delta RUT short strangles, the top exit approaches indicated by the metrics were the: 300:50, ExOut 200:50 and 200:50 variations.  The highest return again occurred with the 200:75 exit, but it's average P&L % / day number was lower than others.


8 Delta Short Strikes
Short Options Strangle Equity Curves RUT 73 DTE 8 Delta Risk:Reward Exits
(click to enlarge)
Short Options Strangle Trade Metrics RUT 73 DTE 8 Delta Risk:Reward Exits
(click to enlarge)
For the 73 DTE, 8 delta RUT short strangles, the top exit approaches indicated by the metrics were the: 300:50, ExOut 200:50, and 200:75 variations.

With the 73 DTE tests, the highest average P&L per day readings occurred with the 8 delta short strike variations, with an average of 0.21% per day.  The highest overall P&L per day reading occurred with the 6 delta 200:25 variation, at 0.26% per day. In the next post we will look at these same deltas and exits, but on the RUT 80 DTE short strangle.


As always, feel free to use any of the images/information on my blog...just be sure to reference this blog when sharing the information with others.


Follow my blog by email, RSS feed or Twitter.  All options are free, and are available on the top of the right hand navigation column under the headings "Subscribe To RSS Feed", "Follow By Email", and "Twitter".  I follow blogs by RSS using Feedly, but any RSS reader will work.