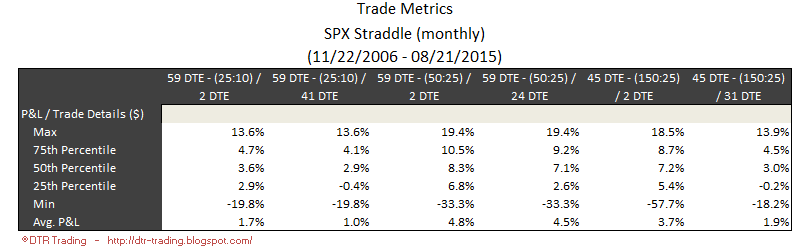
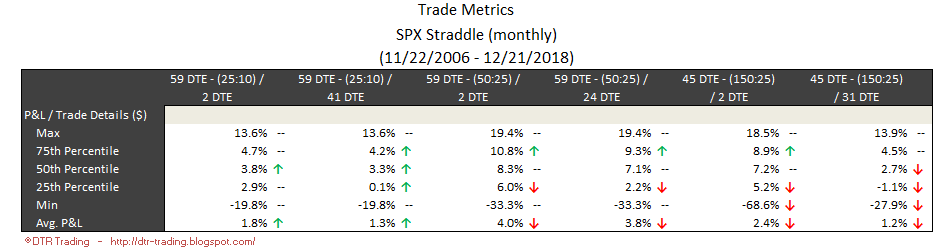
These are the variations we will review:
- 59 DTE - (25:10) / 2 DTE - exit if the trade has a loss of 25% of its initial credit OR if the trade has a profit of 10% of its initial credit OR at 2 DTE.
- 59 DTE - (25:10) / 41 DTE - exit if the trade has a loss of 25% of its initial credit OR if the trade has a profit of 10% of its initial credit OR at 41 DTE.
- 59 DTE - (50:25) / 2 DTE - exit if the trade has a loss of 50% of its initial credit OR if the trade has a profit of 25% of its initial credit OR at 2 DTE.
- 59 DTE - (50:25) / 24 DTE - exit if the trade has a loss of 50% of its initial credit OR if the trade has a profit of 25% of its initial credit OR at 24 DTE.
- 45 DTE - (150:25) / 2 DTE - exit if the trade has a loss of 150% of its initial credit OR if the trade has a profit of 25% of its initial credit OR at 2 DTE.
- 45 DTE - (150:25) / 31 DTE - exit if the trade has a loss of 150% of its initial credit OR if the trade has a profit of 25% of its initial credit OR at 31 DTE.
The 45 DTE variations follow the entry and exit criteria popularized by TastyTrade here:
- https://www.tastytrade.com/tt/shows/market-measures/episodes/straddle-management-targets-01-11-2019
- https://www.tastytrade.com/tt/shows/market-measures/episodes/varying-straddle-duration-08-16-2018
- https://www.tastytrade.com/tt/shows/market-measures/episodes/ultimate-guide-to-managing-straddles-05-18-2018
- https://www.tastytrade.com/tt/shows/market-measures/episodes/straddles-managing-winners-and-losers-06-19-2015
For each variation, I show one table and two charts. The table shows the percent return on portfolio margin. The first chart shows these same return numbers, but compared to their historical returns (max, min, average, and quartiles).The second chart shows the DIT numbers for each variation compared to the average for this variation.
Let's get right to the results for each of these variations.
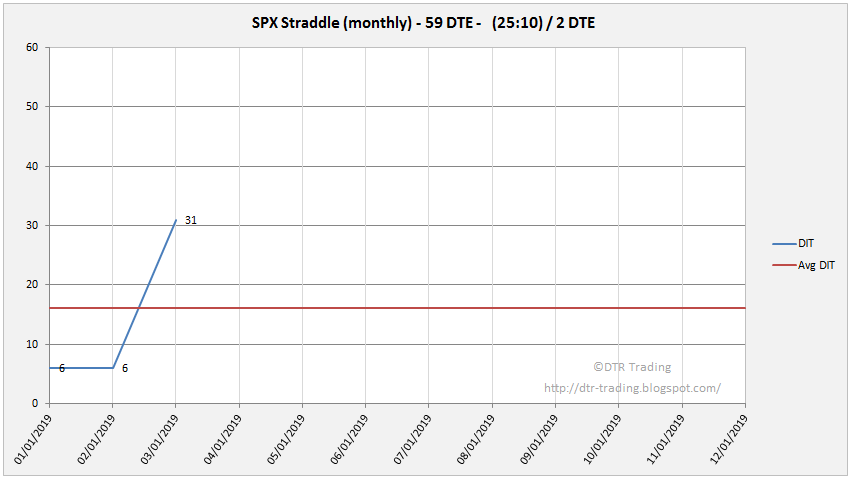
59 DTE - (25:10) / 2 DTE
The average monthly return for Q1 was -21%, versus the 2007 to 2018 monthly average of +2%. Total return for the quarter was -62%. Pretty bad return numbers. The average DIT for Q1 was 14, which was below the 2007 to 2018 average of 16 DIT.
 |
| (click to enlarge) |
 |
| (click to enlarge) |
 |
| (click to enlarge) |
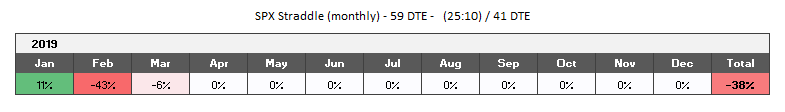
59 DTE - (25:10) / 41 DTE
The average monthly return for Q1 was -13%, versus the 2007 to 2018 monthly average of +1%. Total return for the quarter was -38%. Again, pretty bad return numbers. The average DIT for Q1 was 10, which was below the 2007 to 2018 average of 12 DIT.
 |
| (click to enlarge) |
 |
| (click to enlarge) |
 |
| (click to enlarge) |
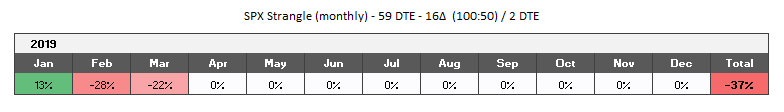
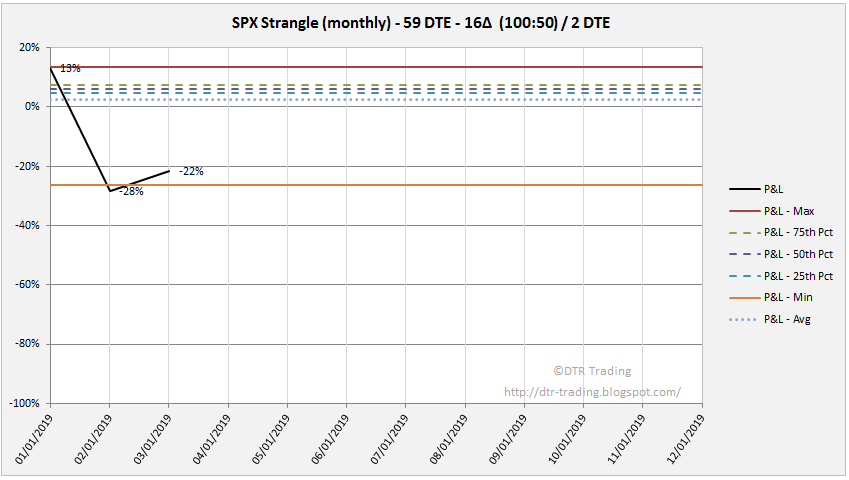
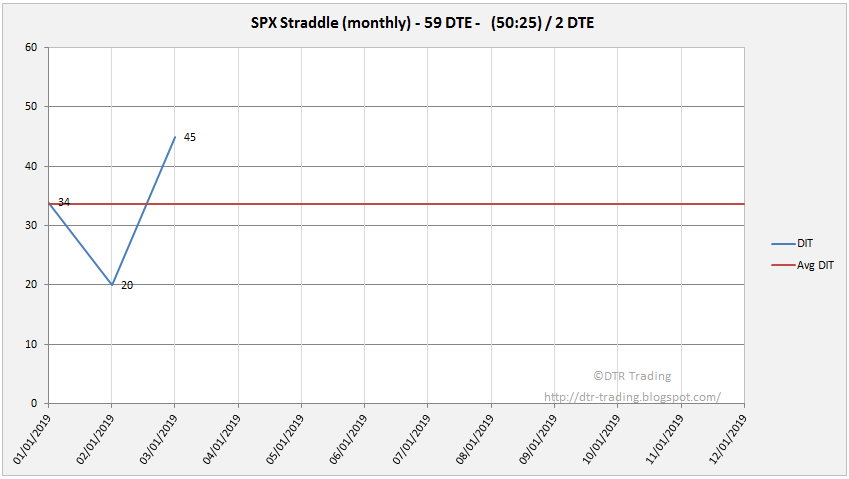
59 DTE - (50:25) / 2 DTE
The average monthly return for Q1 was -34%, versus the 2007 to 2018 monthly average of +4%. Total return for the quarter was -101%. Bad return numbers again. The average DIT for Q1 was 33, which was below the 2007 to 2018 average of 34 DIT.
 |
| (click to enlarge) |
 |
| (click to enlarge) |
 |
| (click to enlarge) |
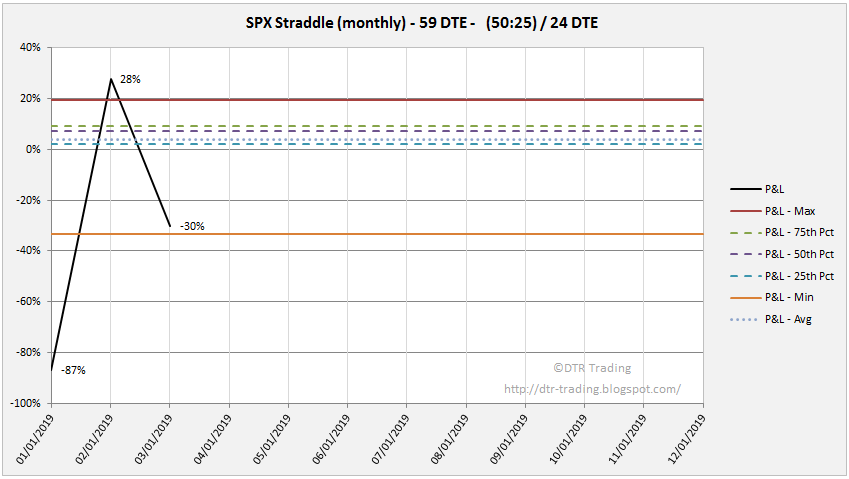
59 DTE - (50:25) / 24 DTE
The average monthly return for Q1 was -30%, versus the 2007 to 2018 monthly average of +4%. Total return for the quarter was -89%. The bad return numbers continue! The average DIT for Q1 was 30, which was above the 2007 to 2018 average of 29 DIT.
 |
| (click to enlarge) |
 |
| (click to enlarge) |
 |
| (click to enlarge) |
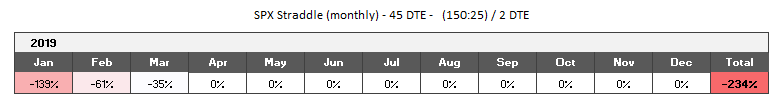
45 DTE - (150:25) / 2 DTE
The average monthly return for Q1 was -78%, versus the 2007 to 2018 monthly average of +2%. Total return for the quarter was -234%! Horrible return numbers for the quarter! The average DIT for Q1 was 35, which was above the 2007 to 2018 average of 28 DIT.
 |
| (click to enlarge) |
 |
| (click to enlarge) |
 |
| (click to enlarge) |
45 DTE - (150:25) / 31 DTE
The average monthly return for Q1 was -11%, versus the 2007 to 2018 monthly average of +1%. Total return for the quarter was -33%. Pretty lousy returns for the Q1. The average DIT for Q1 was 14, which was the same as the 2007 to 2018 average DIT.
 |
| (click to enlarge) |
 |
| (click to enlarge) |
 |
| (click to enlarge) |
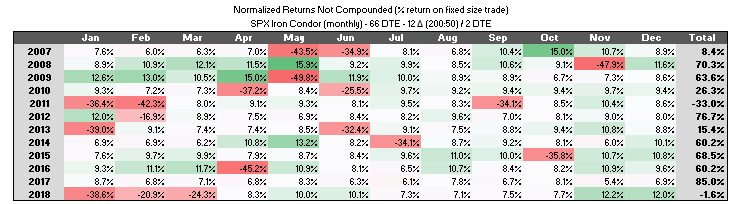
All of the straddle variations had negative returns for the quarter. In the next post, we'll review the Q1 returns for the SPX Iron Condor variations.
If you don't want to miss my new blog posts, follow my blog either by email, RSS feed or by Twitter. All options are free, and are available on the top of the right hand navigation column under the headings "Subscribe To RSS Feed", "Follow By Email", and "Twitter". I follow blogs by RSS using Feedly, but any RSS reader will work.