CustomMenu

Thursday, July 30, 2015

SPX Strangle - High Loss Threshold - 80 DTE

This post looks at selling one-lot options strangles on the S&P 500 Index (SPX), initiated at 80 days-to-expiration (DTE).  The results in this post were derived from more than 2300 individual trades entered by the backtester.  Other 80 DTE variations will be posted on my Twitter feed, @DTRTrading.

For background on the setup for the backtests, as well as the nomenclature used in the charts and tables below, please see the introductory article for this series: Option Strangle Series - Higher Loss Thresholds

In the trade metrics tables, I have highlighted some of the metrics rows to indicate values that are in the upper half of the readings.  One of the metrics to note is the average P&L per day in percentage terms (Trade Details (%) - Avg. P&L / Day).  This is a measure of the P&L per day normalized to the maximum initial portfolio margin (initial PM) required for that trade run...it tells us the effectiveness of theta with respect to our margin requirement.

Also note, that all of the blog posts for the SPX strangle series have equity curves with identical y-axis scales.

4 Delta Short Strikes
Short Options Strangle Equity Curves SPX 80 DTE 4 Delta Risk:Reward Exits
(click to enlarge)
Short Options Strangle Trade Metrics SPX 80 DTE 4 Delta Risk:Reward Exits
(click to enlarge)
For the 80 DTE, 4 delta SPX short strangles, the top exit approaches indicated by the metrics were the: 200:75, 100:50, and 300:50 variations


6 Delta Short Strikes
Short Options Strangle Equity Curves SPX 80 DTE 6 Delta Risk:Reward Exits
(click to enlarge)
Short Options Strangle Trade Metrics SPX 80 DTE 6 Delta Risk:Reward Exits
(click to enlarge)
For the 80 DTE, 6 delta SPX short strangles, the top exit approaches indicated by the metrics were the: 200:75, 300:50, and 100:50 variations.


8 Delta Short Strikes
Short Options Strangle Equity Curves SPX 80 DTE 8 Delta Risk:Reward Exits
(click to enlarge)
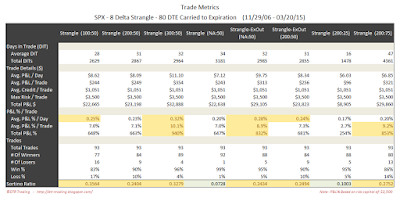
Short Options Strangle Trade Metrics SPX 80 DTE 8 Delta Risk:Reward Exits
(click to enlarge)
For the 80 DTE, 8 delta SPX short strangles, the top exit approaches indicated by the metrics were the: 300:50, ExOut NA:50, and 200:75 variations.

With the 80 DTE tests, the highest average P&L per day reading occurred with the 8 delta short strike variation, with an average of 0.24% per day.  The highest overall P&L per day readings occurred with the 8 delta 300:50 variation, at 0.32% per day.

Below are three images of scatter plots for the 80 DTE 8 delta short strangles.  The first image contains one scatter plot per strategy and shows P&L in dollar terms versus days-in-trade (DIT).  There is one visible trend in this set of scatter plots: the largest losses tend to occur at lower DIT values for trades with a loss based exit.
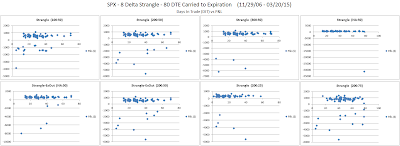
Short Options Strangle DIT versus P&L for SPX 80 DTE 8 Delta Risk:Reward Exits
(click to enlarge)

The second image shows P&L in terms of the initial at-the-money (ATM) implied volatility (IV) of the SPX.  This ATM IV was captured on the day each trade was initiated.  In general, there is a trend that higher P&L numbers are associated with higher ATM IV numbers...similar to the 45 DTE scatter plots.

Short Options Strangle IV versus P&L for SPX 80 DTE 8 Delta Risk:Reward Exits
(click to enlarge)

The last images shows P&L in terms of the initial IV Rank for the SPX.  The IV Rank was captured on the day each trade was initiated.  In general, there is a trend that higher IV rank is associated with higher P&L.  Also, if you trade only when IV rank is higher, you can eliminate many losing trades.  Both of these trends were visible in the 45 DTE scatter plots as well.

Short Options Strangle IV Rank versus P&L for SPX 80 DTE 8 Delta Risk:Reward Exits
(click to enlarge)

In the next post I will summarize the results for the SPX short strangle strategy.

FYI, I am showing the results for higher delta strangles (at the same DTEs), as well as 8 additional exits on my Twitter feed...I won't be posting these additional results to the blog.

You can follow my blog by email, RSS feed or Twitter.  All options are free, and are available on the top of the right hand navigation column under the headings "Subscribe To RSS Feed", "Follow By Email", and "Twitter".  I follow blogs by RSS using Feedly, but any RSS reader will work.

Monday, July 27, 2015

SPX Strangle - High Loss Threshold - 73 DTE

This post looks at selling one-lot options strangles on the S&P 500 Index (SPX), initiated at 73 days-to-expiration (DTE).  The results in this post were derived from more than 2300 individual trades entered by the backtester.  Other 73 DTE variations will be posted on my Twitter feed, @DTRTrading.

For background on the setup for the backtests, as well as the nomenclature used in the charts and tables below, please see the introductory article for this series: Option Strangle Series - Higher Loss Thresholds

In the trade metrics tables, I have highlighted some of the metrics rows to indicate values that are in the upper half of the readings.  One of the metrics to note is the average P&L per day in percentage terms (Trade Details (%) - Avg. P&L / Day).  This is a measure of the P&L per day normalized to the maximum initial portfolio margin (initial PM) required for that trade run...it tells us the effectiveness of theta with respect to our margin requirement.

Also note, that all of the blog posts for the SPX strangle series have equity curves with identical y-axis scales.

4 Delta Short Strikes
Short Options Strangle Equity Curves SPX 73 DTE 4 Delta Risk:Reward Exits
(click to enlarge)
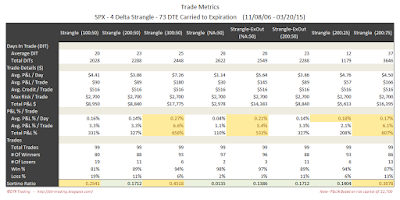
Short Options Strangle Trade Metrics SPX 73 DTE 4 Delta Risk:Reward Exits
(click to enlarge)
For the 73 DTE, 4 delta SPX short strangles, the top exit approaches indicated by the metrics were: 300:50, 200:75, and ExOut NA:50


6 Delta Short Strikes
Short Options Strangle Equity Curves SPX 73 DTE 6 Delta Risk:Reward Exits
(click to enlarge)
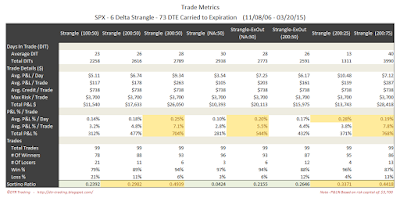
Short Options Strangle Trade Metrics SPX 73 DTE 6 Delta Risk:Reward Exits
(click to enlarge)
For the 73 DTE, 6 delta SPX short strangles, the top exit approaches indicated by the metrics were: 200:75, 300:50 and, ExOut NA:50.


8 Delta Short Strikes
Short Options Strangle Equity Curves SPX 73 DTE 8 Delta Risk:Reward Exits
(click to enlarge)
Short Options Strangle Trade Metrics SPX 73 DTE 8 Delta Risk:Reward Exits
(click to enlarge)
For the 73 DTE, 8 delta SPX short strangles, the top exit approaches indicated by the metrics were: 200:75, 300:50, and, ExOut 200:50.

With the 73 DTE tests, the highest average P&L per day readings occurred with the 8 delta short strike variations, with an average of 0.22% per day.  The highest overall P&L per day reading occurred with the 8 delta 200:25 variation at 0.29% per day.  In the next post we will look at these same deltas and exits, but on the SPX 80 DTE short strangle.

FYI, I am showing the results for higher delta strangles (at the same DTEs), as well as 8 additional exits on my Twitter feed...I won't be posting these additional results to the blog.

You can follow my blog by email, RSS feed or Twitter.  All options are free, and are available on the top of the right hand navigation column under the headings "Subscribe To RSS Feed", "Follow By Email", and "Twitter".  I follow blogs by RSS using Feedly, but any RSS reader will work.
Thursday, July 23, 2015

SPX Strangle - High Loss Threshold - 66 DTE

This post looks at selling one-lot options strangles on the S&P 500 Index (SPX), initiated at 66 days-to-expiration (DTE).  The results in this post were derived from more than 2300 individual trades entered by the backtester.  Other 66 DTE variations will be posted on my Twitter feed, @DTRTrading.

For background on the setup for the backtests, as well as the nomenclature used in the charts and tables below, please see the introductory article for this series: Option Strangle Series - Higher Loss Thresholds

In the trade metrics tables, I have highlighted some of the metrics rows to indicate values that are in the upper half of the readings.  One of the metrics to note is the average P&L per day in percentage terms (Trade Details (%) - Avg. P&L / Day).  This is a measure of the P&L per day normalized to the maximum initial portfolio margin (initial PM) required for that trade run...it tells us the effectiveness of theta with respect to our margin requirement.

Also note, that all of the blog posts for the SPX strangle series have equity curves with identical y-axis scales.

4 Delta Short Strikes
Short Options Strangle Equity Curves SPX 66 DTE 4 Delta Risk:Reward Exits
(click to enlarge)
Short Options Strangle Trade Metrics SPX 66 DTE 4 Delta Risk:Reward Exits
(click to enlarge)
For the 66 DTE, 4 delta SPX short strangles, the top exit approaches indicated by the metrics were: 200:75, NA:50, and ExOut NA:50


6 Delta Short Strikes
Short Options Strangle Equity Curves SPX 66 DTE 6 Delta Risk:Reward Exits
(click to enlarge)
Short Options Strangle Trade Metrics SPX 66 DTE 6 Delta Risk:Reward Exits
(click to enlarge)
For the 66 DTE, 6 delta SPX short strangles, the top exit approaches indicated by the metrics were: 100:50, ExOut NA:50, and 200:75.


8 Delta Short Strikes
Short Options Strangle Equity Curves SPX 66 DTE 8 Delta Risk:Reward Exits
(click to enlarge)
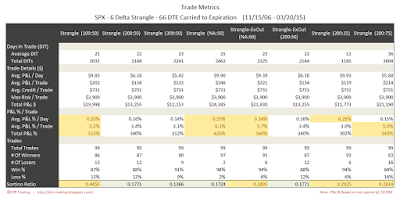
Short Options Strangle Trade Metrics SPX 66 DTE 8 Delta Risk:Reward Exits
(click to enlarge)
For the 66 DTE, 8 delta SPX short strangles, the top exit approaches indicated by the metrics were: 100:50, ExOut NA:50, and 200:75.

With the 66 DTE tests, the highest average P&L per day readings occurred with the 8 delta short strike variations.  The highest overall P&L per day readings occurred with the 8 delta NA:50 and 100:50 variations.  In the next post we will look at these same deltas and exits, but on the SPX 73 DTE short strangle.

FYI, I am showing the results for higher delta strangles (at the same DTEs), as well as 8 additional exits on my Twitter feed...I won't be posting these additional results to the blog.

You can follow my blog by email, RSS feed or Twitter.  All options are free, and are available on the top of the right hand navigation column under the headings "Subscribe To RSS Feed", "Follow By Email", and "Twitter".  I follow blogs by RSS using Feedly, but any RSS reader will work.

Monday, July 20, 2015

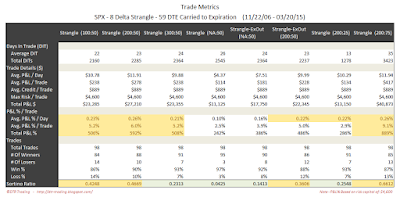
SPX Strangle - High Loss Threshold - 59 DTE

This post looks at selling one-lot options strangles on the S&P 500 Index (SPX), initiated at 59 days-to-expiration (DTE).  The results in this post were derived from more than 2300 individual trades entered by the backtester.

For background on the setup for the backtests, as well as the nomenclature used in the charts and tables below, please see the introductory article for this series: Option Strangle Series - Higher Loss Thresholds

In the trade metrics tables, I have highlighted some of the metrics rows to indicate values that are in the upper half of the readings.  One of the metrics to note is the average P&L per day in percentage terms (Trade Details (%) - Avg. P&L / Day).  This is a measure of the P&L per day normalized to the maximum initial portfolio margin (initial PM) required for that trade run...it tells us the effectiveness of theta with respect to our margin requirement.

Also note, that all of the blog posts for the SPX strangle series have equity curves with identical y-axis scales.

4 Delta Short Strikes
Short Options Strangle Equity Curves SPX 59 DTE 4 Delta Risk:Reward Exits
(click to enlarge)
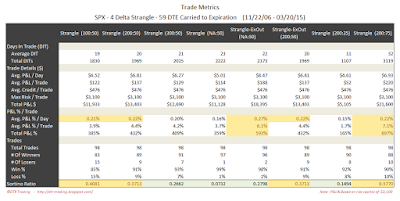
Short Options Strangle Trade Metrics SPX 59 DTE 4 Delta Risk:Reward Exits
(click to enlarge)
For the 59 DTE, 4 delta SPX short strangles, the top exit approaches indicated by the metrics were: 200:75, ExOut NA:50, 200:50, and ExOut 200:50


6 Delta Short Strikes
Short Options Strangle Equity Curves SPX 59 DTE 6 Delta Risk:Reward Exits
(click to enlarge)
Short Options Strangle Trade Metrics SPX 59 DTE 6 Delta Risk:Reward Exits
(click to enlarge)
For the 59 DTE, 6 delta SPX short strangles, the top exit approaches indicated by the metrics were: 200:75, 300: 50 and 200:50.


8 Delta Short Strikes
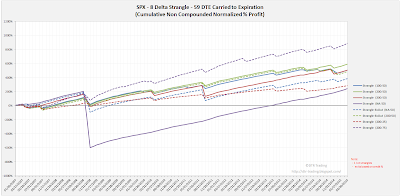
Short Options Strangle Equity Curves SPX 59 DTE 8 Delta Risk:Reward Exits
(click to enlarge)
Short Options Strangle Trade Metrics SPX 59 DTE 8 Delta Risk:Reward Exits
(click to enlarge)
For the 59 DTE, 8 delta SPX short strangles, the top exit approaches indicated by the metrics were: 200:75, 200:50, and 100:50

With the 59 DTE tests, the highest average P&L per day readings occurred with the 8 delta short strike variations.  The 200:75 and 200:50 variations at 8 delta looked particularly good.  In the next post we will look at these same deltas and exits, but on the SPX 66 DTE short strangle.


You can follow my blog by email, RSS feed or Twitter.  All options are free, and are available on the top of the right hand navigation column under the headings "Subscribe To RSS Feed", "Follow By Email", and "Twitter".  I follow blogs by RSS using Feedly, but any RSS reader will work.
Thursday, July 16, 2015

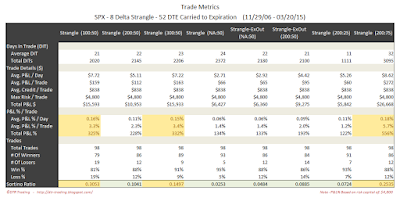
SPX Strangle - High Loss Threshold - 52 DTE

This post looks at selling one-lot options strangles on the S&P 500 Index (SPX), initiated at 52 days-to-expiration (DTE).  The results in this post were derived from more than 2300 individual trades entered by the backtester.

For background on the setup for the backtests, as well as the nomenclature used in the charts and tables below, please see the introductory article for this series: Option Strangle Series - Higher Loss Thresholds

In the trade metrics tables, I have highlighted some of the metrics rows to indicate values that are in the upper half of the readings.  One of the metrics to note is the average P&L per day in percentage terms (Trade Details (%) - Avg. P&L / Day).  This is a measure of the P&L per day normalized to the maximum initial portfolio margin (initial PM) required for that trade run...it tells us the effectiveness of theta with respect to our margin requirement.

Also note, that all of the blog posts for the SPX strangle series have equity curves with identical y-axis scales.

4 Delta Short Strikes
Short Options Strangle Equity Curves SPX 52 DTE 4 Delta Risk:Reward Exits
(click to enlarge)
Short Options Strangle Trade Metrics SPX 52 DTE 4 Delta Risk:Reward Exits
(click to enlarge)
For the 52 DTE, 4 delta SPX short strangles, the top exit approaches indicated by the metrics were: 100:50, 200:50, and ExOut 200:50


6 Delta Short Strikes
Short Options Strangle Equity Curves SPX 52 DTE 6 Delta Risk:Reward Exits
(click to enlarge)
Short Options Strangle Trade Metrics SPX 52 DTE 6 Delta Risk:Reward Exits
(click to enlarge)
For the 52 DTE, 6 delta SPX short strangles, the top exit approaches indicated by the metrics were: 100:50, 200:75, and ExOut NA:50.


8 Delta Short Strikes
Short Options Strangle Equity Curves SPX 52 DTE 8 Delta Risk:Reward Exits
(click to enlarge)
Short Options Strangle Trade Metrics SPX 52 DTE 8 Delta Risk:Reward Exits
(click to enlarge)
For the 52 DTE, 8 delta SPX short strangles, the top exit approaches indicated by the metrics were: 100:50, 200:75, and 300:50.

With the 52 DTE tests, the highest average P&L per day readings occurred with the 4 delta short strike variations.  In the next post we will look at these same deltas and exits, but on the SPX 59 DTE short strangle.


You can follow my blog by email, RSS feed or Twitter.  All options are free, and are available on the top of the right hand navigation column under the headings "Subscribe To RSS Feed", "Follow By Email", and "Twitter".  I follow blogs by RSS using Feedly, but any RSS reader will work.

Monday, July 13, 2015

SPX Strangle - High Loss Threshold - 45 DTE

This is the first article in a series where we will look at the performance of selling options strangles. For background on the setup for the backtests, as well as the nomenclature used in the charts and tables below, please see the introductory article for this series: Option Strangle Series - Higher Loss Thresholds

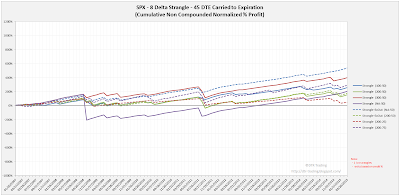
This post looks at a one-lot strangle on the S&P 500 Index (SPX), initiated at 45 days-to-expiration (DTE).  The results displayed below represent data from 2300 individual trades entered by the backtester.  The results are separated by the delta of the short strikes.

In the trade metrics tables, I have highlighted some of the metrics rows to indicate values that are in the upper half of the readings.  One of the metrics to note is the average P&L per day in percentage terms (Trade Details (%) - Avg. P&L / Day).  This is a measure of the P&L per day normalized to the maximum initial portfolio margin (initial PM) required for that trade run...it tells us the effectiveness of theta with respect to our margin requirement.

4 Delta Short Strikes
Short Options Strangle Equity Curves SPX 45 DTE 4 Delta Risk:Reward Exits
(click to enlarge)
Short Options Strangle Trade Metrics SPX 45 DTE 4 Delta Risk:Reward Exits
(click to enlarge)
For the 45 DTE, 4 delta SPX short strangles, the top exit approaches indicated by the metrics were: 300:50, and 200:75.


6 Delta Short Strikes
Short Options Strangle Equity Curves SPX 45 DTE 6 Delta Risk:Reward Exits
(click to enlarge)
Short Options Strangle Trade Metrics SPX 45 DTE 6 Delta Risk:Reward Exits
(click to enlarge)
For the 45 DTE, 6 delta SPX short strangles, the top exit approaches indicated by the metrics were again the 300:50 and 200:75.


8 Delta Short Strikes
Short Options Strangle Equity Curves SPX 45 DTE 8 Delta Risk:Reward Exits
(click to enlarge)
Short Options Strangle Trade Metrics SPX 45 DTE 8 Delta Risk:Reward Exits
(click to enlarge)
For the 45 DTE, 8 delta SPX short strangles, the top exit approaches indicated by the metrics were: ExOut NA:50 and 300:50.  Recall that the ExOut variations will exit: 1) if the market moves below the short put, or 2) if the market moves above the short call, or 3) if the profit is 50% of the credit received, or 4) at expiration...which ever comes first.

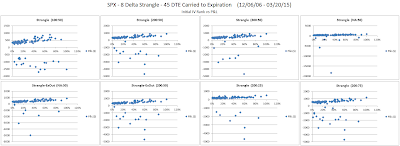
Below are three images of scatter plots for the 45 DTE 8 delta short strangles.  The first image contains one scatter plot per strategy and shows P&L in dollar terms versus days-in-trade (DIT).  There are a couple of visible trends in this set of scatter plots: 1) in general, the longer a trade is held, the higher the profit, and 2) the largest losses tend to occur at lower DIT values for trades with a loss based exit.

Short Options Strangle DIT versus P&L for SPX 45 DTE 8 Delta Risk:Reward Exits
(click to enlarge)

The second image shows P&L in terms of the initial at-the-money (ATM) implied volatility (IV) of the SPX.  This ATM IV was captured on the day each trade was initiated.  In general, there is a trend that higher P&L numbers are associated with higher ATM IV numbers.

Short Options Strangle IV versus P&L for SPX 45 DTE 8 Delta Risk:Reward Exits
(click to enlarge)

The last images shows P&L in terms of the initial IV Rank for the SPX.  The IV Rank was captured on the day each trade was initiated.  In general, there is a trend that higher IV rank is associated with higher P&L.  Also, if you trade only when IV rank is higher, you can eliminate many losing trades.

Short Options Strangle IV Rank versus P&L for SPX 45 DTE 8 Delta Risk:Reward Exits
(click to enlarge)

In the next post we will look at these same deltas and exits, but on the SPX 52 DTE short strangle.


You can follow my blog by email, RSS or Twitter.  All options are free, and are available on the top of the right hand navigation column under the headings "Subscribe To RSS Feed", "Follow By Email", and "Twitter".  I follow blogs by RSS using Feedly, but any RSS reader will work.

Thursday, July 9, 2015

Option Strangle Series - Higher Loss Thresholds

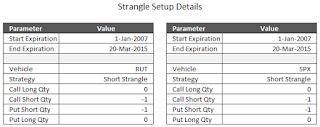
During the next several weeks, I will show the backtest results for selling Strangles on the Russell 2000 Index (RUT) and S&P 500 Index (SPX).  The prior post, Introduction To Options Strangles, introduced Strangles and compared them with Iron Condors.  For this new series, we will look the following setup:

RUT and SPX short strangle backtest setup
(click to enlarge)

These short Strangles will be entered at six different days-to-expiration (DTE): 45, 52, 59, 66, 73, and 80.  For each of these DTE, we will test selling Strangles with short strikes at three different delta: 4, 6, and 8.

The core of this series is related to the exits.  The following 8 exits will be tested:
  1. Strangle (100:50) - exit if the trade has a loss of 100% of its initial credit OR if the trade has a profit of 50% of its initial credit OR at Expiration.
  2. Strangle (200:50) - exit if the trade has a loss of 200% of its initial credit OR if the trade has a profit of 50% of its initial credit OR at Expiration.
  3. Strangle (300:50) - exit if the trade has a loss of 300% of its initial credit OR if the trade has a profit of 50% of its initial credit OR at Expiration.
  4. Strangle (NA:50) - exit if the trade has a profit of 50% of its initial credit OR at Expiration.
  5. Strangle-ExOut (NA:50) - exit if the moves beyond either short strike OR if the trade has a profit of 50% of its initial credit OR at Expiration.
  6. Strangle-ExOut (200:50) - exit if the moves beyond either short strike OR if the trade has a loss of 200% of its initial credit OR if the trade has a profit of 50% of its initial credit OR at Expiration.
  7. Strangle (200:25) - exit if the trade has a loss of 200% of its initial credit OR if the trade has a profit of 25% of its initial credit OR at Expiration.
  8. Strangle (200:75) - exit if the trade has a loss of 200% of its initial credit OR if the trade has a profit of 75% of its initial credit OR at Expiration.
To clarify how these exits function, let's look at an example of the Strangle-ExOut (200:50) variation.  In this example, lets assume the RUT is at 1200, and our strangle short strikes are 1100 for the puts, and 1300 for the calls.  If we sell a 1-lot Strangle for $200, we would take our loss when the Strangle had to be bought back at $600.  $600 - $200 = $400, or a loss of 200% or our initial credit.  For this example, our profit taking would occur when we could buy back the Strangle for $100.  $200 - $100 = $100, or 50% or our initial credit.  Our other loss exit would occur if the RUT dropped below 1100, or went above 1300.  This price movement exit would only trigger if the prior loss related exit had not yet triggered.

These exits can also be thought of as risk:reward exits.  Using the prior example of the Strangle-ExOut (200:50), we are risking 200% to make 50%.  These odds don't sound great from a classical stock strategy approach, but the win rate and probabilities of exit are key components of the Strangle strategy's profitability.


If you don't want to miss my new blog posts, follow my blog either by email, RSS feed or by Twitter.  All options are free, and are available on the top of the right hand navigation column under the headings "Subscribe To RSS Feed", "Follow By Email", and "Twitter".  I follow blogs by RSS using Feedly, but any RSS reader will work.

Monday, July 6, 2015

Introduction To Options Strangles

This is the first post on selling options Strangles, and will introduce the strategy structure.  In subsequent posts, we will look at the back test results for short Strangles on the SPX and RUT.

A short Strangle is essentially a short iron condor, but without the long strikes.  Since the long strikes are missing, the strategy has undefined risk.  Let's look at some examples, based on the RUT options closing prices on July 2, 2015.  On this date, the August options were expiring in 48 days (48 DTE), which is close to our typical trading window.  The put and call strikes below are available to construct our Strangles.  In these images, you can see many of the important attributes for each option, including delta, price, and probabilities.

RUT Put Options Chain - July 2nd, 2015
(click to enlarge)
RUT Call Options Chain - July 2nd, 2015
(click to enlarge)

Since the future back test results posts will look at Strangles at 4, 6, and 8 delta, I'll use these strikes in my examples below.  I will show examples of Strangles at each of these deltas, as well as Iron Condors at these deltas.  Notice the absence of long strikes in the Strangles, as well as the theta, credit, and risk.  Here we go...

RUT 4 Delta Strangle
RUT 4 Delta Strangle - Aug 2015
(click to enlarge)
  • Portfolio Margin Req: $3,708
  • Delta: 0.02952
  • Theta: 17.51878
  • Credit Received: $335
  • Risk: undefined

RUT 4 Delta Iron Condor
RUT 4 Delta Iron Condor - Aug 2015
(click to enlarge)
  • Portfolio Margin Req: $1,123
  • Delta: -1.08191
  • Theta: 4.38734
  • Credit Received: $110
  • Risk: $1,890

RUT 6 Delta Strangle
RUT 6 Delta Strangle - Aug 2015
(click to enlarge)
  • Portfolio Margin Req: $4,251
  • Delta: -0.48099
  • Theta: 22.50901
  • Credit Received: $490
  • Risk: undefined

RUT 6 Delta Iron Condor
RUT 6 Delta Iron Condor - Aug 2015
(click to enlarge)
  • Portfolio Margin Req: $1,184
  • Delta: -1.80523
  • Theta: 5.16398
  • Credit Received: $155
  • Risk: $1,845

RUT 8 Delta Strangle
RUT 8 Delta Strangle - Aug 2015
(click to enlarge)
  • Portfolio Margin Req: $4,809
  • Delta: -1.48944
  • Theta: 27.56221
  • Credit Received: $675
  • Risk: undefined

RUT 8 Delta Iron Condor
RUT 8 Delta Iron Condor - Aug 2015
(click to enlarge)
  • Portfolio Margin Req: $1,221
  • Delta: -3.20900
  • Theta: 7.27385
  • Credit Received: $247
  • Risk: $1,753

Across the board, we see higher compensation for increased risk.  Since we don't buy longs for Strangles, we have a greater credit received.  In addition, since we don't have long strike in a short Strangle, we have higher theta.  So, in exchange for undefined risk, we receive much higher credits, and much greater theta...we get paid more and the money comes in faster.

With a strangle, we need to be more aggressive at loss management...we can't let these trades get away from us, or we could potentially have huge losses.

In the next post, I will describe the exits that will be backtested, and some trade setup details.


If you don't want to miss my new blog posts, follow my blog either by email, RSS feed or by Twitter.  All options are free, and are available on the top of the right hand navigation column under the headings "Subscribe To RSS Feed", "Follow By Email", and "Twitter".  I follow blogs by RSS using Feedly, but any RSS reader will work.