For background on the setup for the backtests, as well as the nomenclature used in the charts and tables below, please see the introductory article for this series: Option Straddle Series - P&L Exits.
No IV Rank Filter
In this section we will look at the results of entering one trade for every monthly expiration regardless of the implied volatility rank (IVR) of the SPX on the date of entry. Entering these trades at 45 DTE and utilizing our loss exits and 45% credit exits (described here), resulted in the equity curves below.
 |
| (click to enlarge) |
The trade metrics for these different exits are shown in the table below. The (125:45) variation stood out with the best P&L % / day reading, highest overall P&L %, and the best win rate. Several of these metrics were the same as other strategy variations. The second place strategy was the (150:45) variation.
 |
| (click to enlarge) |
The table below shows the distribution of returns in five-number summary format. Hat-tip to tastytrade.
 |
| (click to enlarge) |
Below are three sets of scatter plots for selling 45 DTE ATM SPX straddles. The first image contains one scatter plot per strategy and shows P&L in percentage terms versus IVR for the SPX. The IVR was captured on the day each trade was initiated. At this level of profit taking it is difficult to distinguish the trend of increasing P&L with increasing IVR, but it is still evident.
| (click to enlarge) |
The next image shows P&L in percentage terms versus initial ATM IV. This ATM IV was captured on the day each trade was initiated. Higher IV resulted in higher returns, but the majority of the profitable and unprofitable trades occurred at lower IV...below 30. The lower win rate at the 45% profit taking level makes it difficult to see the trend, since there are nearly as many losing trades as winning trades.
 |
| (click to enlarge) |
The third image shows P&L in percentage terms versus days-in-trade (DIT). In order to extract 45% of the credit, the trade duration needs to be longer...this is clearly evident with the clustering of profitable trades above 25 DIT. At the higher loss management levels, 125% and greater, most of the losses were realized at expiration. This is the same pattern we noticed with the 38 DTE trades using the 45% win management level.
 |
| (click to enlarge) |
IV Rank > 50% Filter
In this section we will look at the results of entering one trade for every monthly expiration only when the IVR of the SPX is greater than 50% ( >50% ). Entering these trades at 45 DTE and utilizing our loss exits and 45% credit exits (described here) resulted in the equity curves below.
 |
| (click to enlarge) |
The trade metrics for these different exits are shown in the table below. As we've seen with the earlier articles, there are significantly fewer trades that meet the >50% IVR criteria. The P&L% per day readings and win rates are much higher at the higher loss levels (125%, 150%, 175% and 200%). We observed this pattern with the 10%, 25%, and 35% profit management also.
 |
| (click to enlarge) |
The table below shows the distribution of returns in five-number summary format.
 |
| (click to enlarge) |
IV Rank < 50% Filter
In this section we will look at the results of entering one trade for every monthly expiration only when the IVR of the SPX is less than 50% ( <50% ). Entering these trades at 45 DTE and utilizing our loss exits and 45% credit exits (described here) resulted in the equity curves below. These filtered trades have had a very good run all of 2015, an this trend was present in the 35% profit management level also.
 |
| (click to enlarge) |
The trade metrics for these different exits are shown in the table below. Using the lower IVR filter did not improve any of the metrics.
 |
| (click to enlarge) |
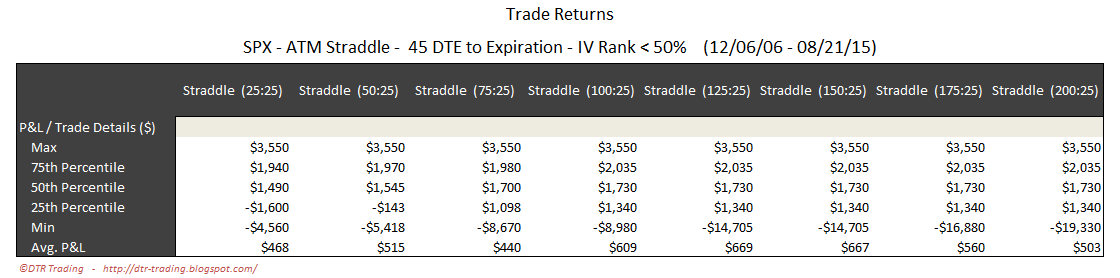
The table below shows the distribution of returns in five-number summary format.
 |
| (click to enlarge) |
In the next post I'll summarize the automated backtest results of the 45 DTE ATM SPX short straddles, before moving on to the 52 DTE straddle series.
Follow my blog by email, RSS feed or Twitter (@DTRTrading). All options are available on the top of the right hand navigation column under the headings "Subscribe To RSS Feed", "Follow By Email", and "Twitter".