For some background on how the results are presented and to read my prior dynamic exit posts, please visit the summary page: Dynamic Exit Iron Condor Articles.
As discussed in the two overview posts on the summary page above, we will look at the same three Iron Condor starting structures that have been backtested on this blog: Standard (STD), Delta Neutral (DN), and Extra Long Put (EL).
Also as discussed in the two overview posts, we will look at three different exits on each of these three starting structures:
- ML40% - this is a Margin Loss % Exit. Trades using this exit strategy either exit at 8 DTE OR if the trade has a loss greater than 40% of the margin requirement for the trade. (ML40% = Max Loss 40%)
- BSP - this is a Price Movement Exit. Trades using this exit strategy either exit at 8 DTE OR if the price of the underlying (RUT) moves below the strike of the short put. (BSP = Below Short Put).
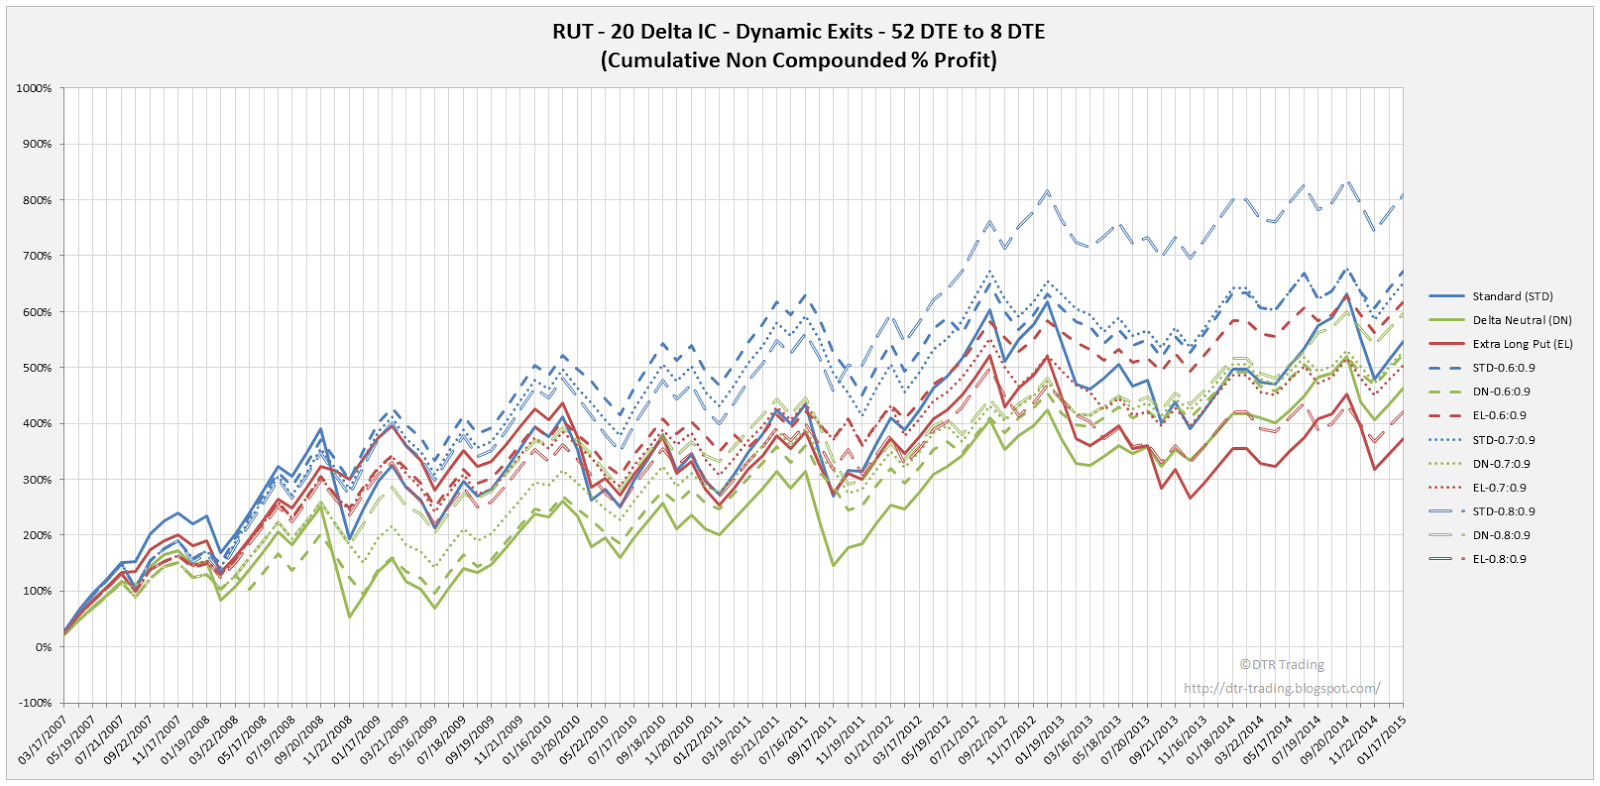
- 0.6:0.6 - This is an Initial Credit % Profit/Loss Exit. Trades using this exit strategy either exit at 8 DTE OR if the trade has a profit of 60% of its initial credit OR if the trade has a loss of 60% of its initial credit. This can also be thought of as risk:reward; risking 60% to make 60%.
This equity curve chart below is similar to the equity curves in my prior posts, with one exception...the y-axis scale was increased from 1000% to 1400%. All of the 16 delta and 20 delta equity curve charts contained at least one result set that exceeded the 1000% threshold on the prior charts. In all of the 16 and 20 delta charts, I have colored the y-axis in red, and included a dashed red line at the 1000% level to highlight the fact that the scale is different on these charts.
This equity curve chart below is similar to the equity curves in my prior posts. In the chart below, all of the STD Iron Condor versions have blue equity curves, all of the DN Iron Condor versions have green equity curves, and all of the EL Iron Condor versions have red equity curves. The solid lines represent the equity curves for the "no touch" version, while the dashed lines represent the equity curves for the dynamically exited versions.
 |
| (click to enlarge) |
The three highest overall returns went to the Standard (STD) Iron Condor variations in order: STD-ML40%, STD without dynamic exits, and STD-0.6:0.6. The ML40% version closed at either 8 DTE or when the loss calculated on margin exceeded 40%. The STD-0.6:0.6 version closed at either 8 DTE, a profit of 60% of the initial credit received, or a loss of 60% of the initial credit received.
The details associated with each of the starting structure backtests can be found in the posts below:
- Standard Iron Condor - RUT - 66 DTE
- Delta Neutral Iron Condor - RUT - 66 DTE
- Extra Long Put Iron Condor - RUT - 66 DTE
In the next post I will show the results for the 66 DTE, 20 delta short strike Iron Condor options trading strategy, with varying Initial Credit % Profit/Loss Exits.
If you don't want to miss my new blog posts, follow my blog either by email, RSS feed or by Twitter. All options are free, and are available on the top of the right hand navigation column under the headings "Subscribe To RSS Feed", "Follow By Email", and "Twitter". I follow blogs by RSS using Feedly, but any RSS reader will work.