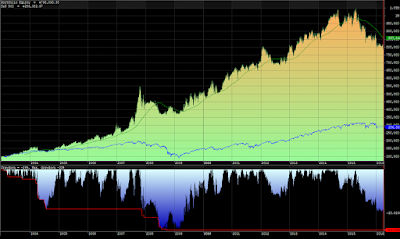
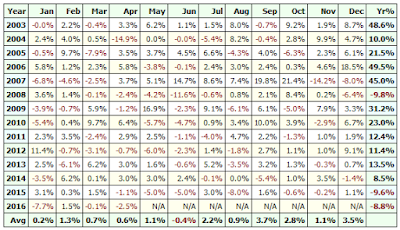
In this post we will look at the current performance of a momentum rotation system for AmiBroker that I showed in an earlier post here. This momentum rotation system ranks a portfolio of products based on their 60 day rate of change. The product with the largest positive change in the portfolio is selected for entry. If all of the products in the portfolio have a negative rate of change...a price today that is lower than the price 60 trading days ago, then the system will move to cash. The system runs on the last trading day of the month, and executes orders at the close - "market on close" orders in live trading.
This momentum rotation system was run against the products listed below in the March 2015 post. We will use the same products for this post.
- EEM - iShares MSCI Emerging Markets Index ETF - trade-able April 2003
- EFA - iShares MSCI EAFE Index ETF - trade-able August 2001
- FXI - iShares China Large-Cap ETF - trade-able October 2004
- IEF - iShares 7-10 Year Treasury Bond ETF - trade-able July 2002
- IYR - iShares Dow Jones US Real Estate ETF - trade-able June 2000
- SHY - iShares 1-3 Year Treasury Bond ETF - trade-able July 2002
- SPY - SPDR S&P 500 Trust ETF - trade-able January 1993
- TIP - iShares Barclays TIPS Bond ETF - trade-able December 2003
- UUP - PowerShares DB US Dollar Bullish ETF - trade-able March 2007
- XLV - Health Care Select Sector SPDR ETF - trade-able December 1998
So how has this momentum rotation system performed since last March? Pretty poorly! March of 2015 was the high water mark for this system's equity curve. Since that time, the equity curve has dropped 23.82%.
 |
| (click to enlarge) |
 |
| (click to enlarge) |
The ETFs held by date are shown in the chart below. Early in the life of this system, it was not uncommon to hold the same ETF for several months. Trade duration has shortened in last few years.
 |
| (click to enlarge) |
The score for each ETF by date can be downloaded from Google Docs: Rank By Date. Note that the score is calculated based on the closing prices the day before the last trading day of the month. This score is then used to rank the ETSs and determine the trade for the last day of the month (using a market on close order).
The trade log for this system can be downloaded from Google Docs: Trade Log
In my next post, I will review some metrics for this system and how they have changed over the years.
Follow my blog by email, RSS feed or Twitter (@DTRTrading). All options are available on the top of the right hand navigation column under the headings "Subscribe To RSS Feed", "Follow By Email", and "Twitter".