- New Iron Condor Series Introduction
- 38 DTE SPX Iron Condor Results Summary
- 38 DTE SPX Iron Condor Results Summary - Part 2
- 45 DTE SPX Iron Condor Results Summary
- 45 DTE SPX Iron Condor Results Summary - Part 2
- 52 DTE SPX Iron Condor Results Summary
- 59 DTE SPX Iron Condor Results Summary
- 66 DTE SPX Iron Condor Results Summary
- 73 DTE SPX Iron Condor Results Summary
- 80 DTE SPX Iron Condor Results Summary
In this article, I'll review two key metrics collected from all of the backtests:
- Win Rate
- Normalized P&L Per Day
Win rate is a common metric to analyze, but P&L per day is less obvious. P&L per day gives us a very clear view of the expected return by day for a given strategy variation. We've already seen in the prior posts how the number of days in trade (DIT) increases as we enter trades at higher days to expiration (DTE). As a very rough rule of thumb, it takes about half the DTE to collect 50% of the credit (although this changes with short strike delta!). From this normalized P&L per day value we can derive the average return per trade, as well as the average return per year.
Next, the first column lists the strategy variation, including the exit used. This column uses the strategy description nomenclature that I used in the last several months worth of articles in the links above.
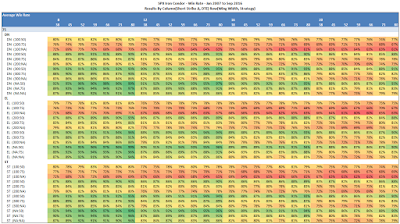
Next, there are four groups of seven columns. Each group corresponds to a different short strike delta, and each of the seven columns in the group corresponds to a different DTE starting point.
Win Rate
 |
| (click to enlarge) |
It's clear that the 8 delta short strike has the highest win rates from a delta perspective. Also, 80 DTE has the highest win rate of all of the DTE tested. The 50% profit taking level is the winner for profit taking exits. We also see that the larger wing widths have slightly higher win rates. Let's think about each of these points:
- Both the smaller delta and higher DTE end up making a wider "tent" for the IC, which gives the market more room to run before a loss exit is triggered.
- Taking profits at 50% versus 75% or expiration has you out of the trade sooner...reducing the chance that the market can move against your position.
- The larger wing width, creates a larger credit, and at 75 points approximates a naked strangle. With 75 point wings, you get the margin relief (defined risk) from the long options that you don't get with a strangle. Since the longs are so far away from the short strikes, this structure has greater theta decay than ICs with 25 and 50 point wings.
It's interesting to note that the win rate for the same short strike delta increases with increasing DTE. Recall, as DTE increases the implied volatility (IV) for the same delta option increases. For example, an 8 delta put at 38 DTE might have an IV of 14.15% while an 8 delta put at 80 DTE might have an IV of 17.44%. Using these two examples of IV we calculate the expected one standard deviation move of the underlying in percent:
- 0.1415 x sqrt(38/365) = 0.045656 (+/- 4.57%)
- 0.1744 x sqrt(80/365) = 0.081648 (+/- 8.16%)
Note: IV from TOS for each of these option chains is lower at approximately 11.5% and 12.6% respectively
Based on these expected moves, it's worth considering a couple of questions. How does actual market movement over 40 days (half of 80 DTE) compare with the expected move? How do the actual market moves over 19 days (half of 38 DTE) compare with those over 40 days?
 |
| (click to enlarge) |
P&L Per Day
Recall from the prior articles that all of the P&L per day numbers are normalized. The P&L per day values shown in the charts below are expressed as a percentage of the max risk for that test run. Each of the different wing width ICs (25 point, 50 point, 75 point) will have a different max risk, and it is important to normalize daily returns by the associated max risk number. For example, a 25 point IC will have slightly less than $25K max risk (margin), while a 75 point IC will have slightly less than $75K max risk (margin). Since the 25 point IC will have approximately 1/3 the risk/margin, the $ returns need to be normalized by these varying max risk / margin numbers for proper strategy variation comparison.
 |
| (click to enlarge) |
There are a few high level trends from these tables of normalized P&L % per day values:
- The lowest returns occur with the EL structure. The extra long put negatively impacts the theta decay of the structure, but this negative impact decreases (as we'd expect) as wing width increases
- The next lowest returns occur with the DN structure. Since there are fewer call credit spreads than put credit spreads in this structure, there is lower theta decay than with the ST structure
- The ST structure has the highest normalized P&L % per day numbers
- From a short strike delta perspective, the lowest returns per day occur at 8 delta, and the highest returns occur in the 16 to 20 delta range
- The 75 point wing structures have the lowest returns, and the 25 point wing structures have the highest returns
- From a DTE perspective:
- The DN structures' returns are highest in the 38 to 45 DTE range
- The EL structures' returns are highest in the 73 to 80 DTE range
- The ST structures' returns are highest in the 73 to 80 DTE range, but there is also a second high return clustering in the 38 to 45 DTE range
The return distributions related to structure and DTE, suggest that in the 38 to 45 DTE range, the market has tended to trend up or stay flat. Hence the clustering of higher daily return numbers for the DN structure in the 38 to 45 DTE range. Additionally, the data suggest that in the 73 to 80 DTE range the market has tended to stay flat or drop. The EL structure shows higher returns in longer duration trades, indicating that the extra long put has some benefit in the 73 to 80 DTE range.
 |
| (click to enlarge) |
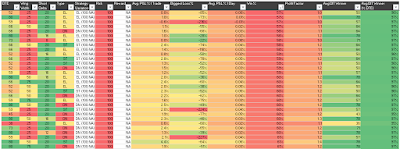
In the next article, we'll narrow down the list of 3024 strategy variations, to a list of strategies that look trade-able. I'll remove the variations without profit and loss exits, and look at win rate, normalized P&L per day, largest loss, and profit factors.
Also, over the next several days I'll use Twitter to share other versions of the tables above, organized around DTE groupings instead of grouping by short strike delta..
Follow my blog by email, RSS feed or Twitter (@DTRTrading). All options are available on the top of the right hand navigation column under the headings "Subscribe To RSS Feed", "Follow By Email", and "Twitter".


