In this post we will review the performance of the 31 DTE RUT "no touch" IC's put credit spreads and call credit spreads independently. The heat graphs below show the performance of the different delta variations of the strategy, with the performance of the call credit spreads shown separately from the performance of the put credit spreads for the same expiration date.
With the "no touch" 8 delta version, the call spreads lost 10 times since 2007, while the put spreads also lost 10 times. The percentages are 11%. We can also compare the sum of all the losing percentages for the call spreads and put spreads separately. For the 8 delta version, the sum of the negative returns for the calls was -164% versus -190% for the puts. The total magnitude of the losing put trades was larger. The average loss for the losing call spreads was -16%, while the average loss for the losing put spreads was -19%. The big losses on the put side occurred in fall of 2008 and the late summer of 2011.

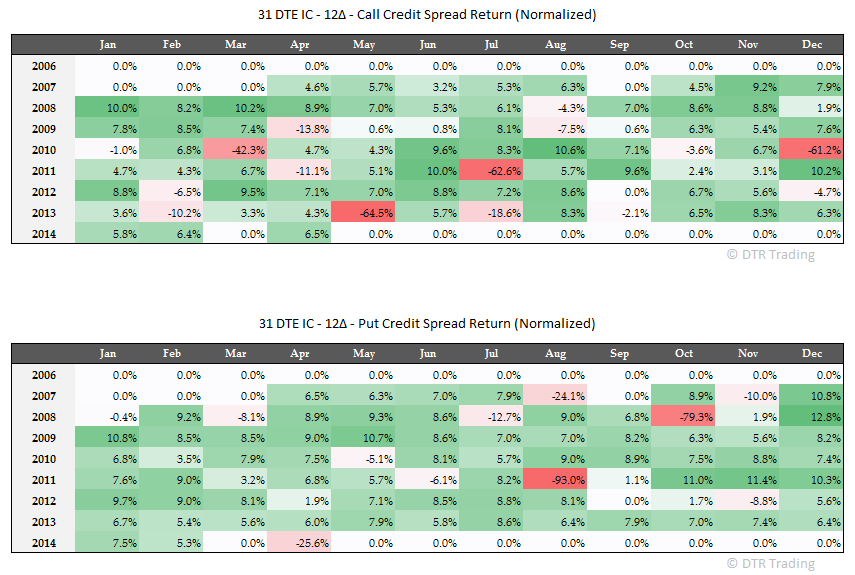
For the 12 delta version, the calls lost 15 times, while the puts lost 11 times. 17% and 13% respectively. The sum of the negative returns for the calls was -314% versus -273% for the puts. The calls contributed more to the total loses than the puts, and the call loses occurred more frequently. The average loss for the losing call spreads was -21%, while the average loss for the losing put spreads was -25%.
For the 16 delta version, the calls lost 18 times, while the puts lost 13 times. 21% and 15% respectively. The sum of the negative returns for the calls was -480% versus -382% for the puts. Again, the calls contributed more to the total loses than the puts, and the call loses occurred more frequently. The average loss for the losing call spreads was -27%, while the average loss for the losing put spreads was -29%.

For the 20 delta version, the calls lost 23 times, while the puts lost 15 times. 26% and 17% respectively. The sum of the negative returns for the calls was -682% versus -519% for the puts. The calls again contributed more to the total loses than the puts, and the call loses occurred more frequently. The average loss for the losing call spreads was -30%, while the average loss for the losing put spreads was -35%.

The call spreads lost the same or more often than the put spreads. The magnitude of the average loss for each put side loss was larger than the average loss for each call side loss for all delta variations. The total losses on the call side were larger than the total losses on the put side (except for the 8 delta variation), and this difference grew larger as the size of the short delta increased. Again, most of the losses in these trades in the last year and a half have occurred on the call side.
No comments:
Post a Comment