These SPX backtests will be "no touch" tests; there will be no adjustments during the trades In addition, there will be no hedging to start the positions leaning one direction or another. Many of these settings are available in the backtester, but we will only look at this baseline IC case initially. The setup details are shown in the table below:
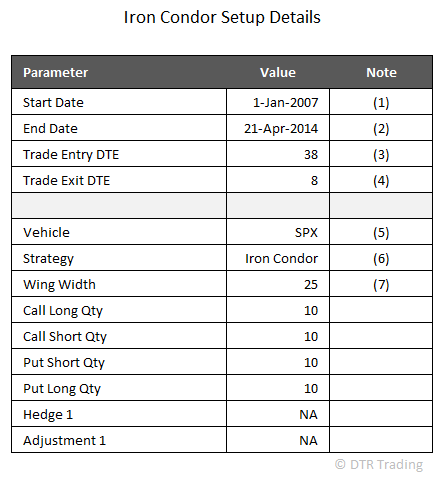
(1) The backtester will start looking for trades that meet the entry DTE requirement after this date
(2) The backtester will not take any trades that will have an exit DTE after this date
(3) Some trading platforms call 38 DTE, 36 DTE (e.g., TOS). The OSB uses a DTE based on the number of days to the expiration date in the option code/opra code, which is a Saturday for indexes
(4) Some trading platforms call 8 DTE, 6 DTE (e.g., TOS)
(5) S&P 500 Index options
(6) Four 38 DTE "no-touch" iron condors will be tested with their short strikes at varying deltas (8, 12, 16, and 20)
(7) The distance between the short call and long call (also, the distance between the short and long puts). This number was 20 for the RUT, but had to be increased to 25 for the SPX due to options availability at longer DTE.
The equity curves for each of the four delta variations are shown in the graph below. In addition to the equity curves, the ATM IV at trade initiation is also plotted (the average of the ATM call IV and ATM put IV). Please note that the dates in the chart are expiration dates.
If I pick a random expiration date, for example 02/21/2009, we can see that when the trade was initiated, the ATM IV was 43. When the trade was closed, the cumulative non-compounded profit had grown to between $7.3k and $33.0k depending on the short delta of the variation of the strategy.

In the table below are the standard trade metrics for the four ICs with different short strikes (8 delta, 12 delta, 16 delta, and 20 delta). In the equity curve image above, the 12 and 16 delta variations appear to be the most "well behaved" and this is confirmed by the Sharpe and Sortino ratios below.

Similar to the other "no touch" trades tested, there are some big drawdowns in these trades because of the lack of adjustments and hedging. The number of winning trades increases as the size of the short deltas decreases..the further away from ATM, the higher the win rate. The combination of shorter DTE and closeness of the short strikes makes the higher delta condors have a lower win rate. The non-compounded AGR on the SPX decreases as the delta of the short strike decreases, except for 16 and 20 delta variations, where the 20 delta AGR is less than the 16 delta AGR...this happened with the 31 DTE version also!
In the heat maps, we can see the performance by expiration month of each of the individual trades of each of the four delta variations. The 0% cells represent expiration months were no trade was initiated. Some of these 0% cells are due to lack of data or bad prints on the trade entry day...leading the backtester to skip that month for testing.


We can also look at the 8 delta strategy in terms of the P&L range (in %), range of the underlying (in %), and IV range (in %), for each trade by expiration month. This data is shown in the graphs below. These graphs are showing the open, which is the 0% level, the high (green bar), the low (red bar), and the value at trade close (the blue line). Also, note that the months shown on the horizontal axis are not displaying expiration dates in order to make the charts less cluttered with axis labels.
The top graph displays P&L range for the 8 delta variation of the 38 DTE "no touch" IC. Even with the short duration of these trades, you can see that when a trade closes profitably the range is mostly on the positive side of the graph.
The middle graph shows the range of the underlying, the SPX, in percent terms during the life of each trade.
The bottom graph shows the ATM IV range and closing value in percent terms, during the life of each IC trade. IV decays to zero as we approach expiration, so you would expect these bars to be mostly red, with the closing value to be negative (the blue line). There were several times where ATM IV finished higher, usually when there were market drops.

The next three graphs show the P&L range for the 12 delta, 16 delta, and 20 delta variations of this 38 DTE "no touch" IC strategy. You can see the increase in P&L volatility as the delta increase from 12 to 20.

In the next post I will move on to the 52 DTE "no touch" SPX IC. Drop me a note if you'd like to see different data presented, and I'll do my best to incorporate your suggestions in upcoming posts.
2 comments:
what happened with the november 2013 trade that made the results so poor? it looks the spx went up about 50 points or so between 11/1/13 and early december, so i would have thought the IC would have been profitable. can you explain what i'm missing? thanks!
Hi,
Thank you for your question.
All of the dates in the graphs represent the expiration dates of the options. The date 11/01/2013 corresponds to the November 2013 expiration or the date of 11/16/2013.
For this expiration, the trades were initiated on 10/09/2013 and closed on 11/08/2013. On 10/09/2013 the SPX closed at 1656.40, and on 11/08/2013 the SPX closed at 1770.61...a 114 point upside move. The market moved well past the short strike of the call spreads (and depending on the delta either at or past the long strike!). All of these trades hit their max loss on the upside call spreads.
I will try to make it more clear in future posts that the charts and graphs represent stats by expiration date rather than calendar date.
Thanks,
Dave
Post a Comment