- Standard: 10 put credit spreads, and 10 call credit spreads
(72 total backtests / more than 80 trades per backtest) - Delta Neutral: 10 put credit spreads, and from 5 to 10 call credit spreads - the number is adjusted at trade initiation to create a delta neutral IC. This structure will reduce losses when up moves occur during the life of the trade.
(32 total backtests / more than 80 trades per backtest) - Extra Long Put: 10 put credit spreads, 10 call credit spreads, and 1 extra long put. This structure will reduce losses when down moves occur during the life of the trade.
(32 total backtests / more than 80 trades per backtest)
We looked at how the three structures performed on the Russell 2000 Index (RUT) and the S&P 500 Index (SPX). We also looked at how the Standard structure performed on the NASDAQ 100 Index (NDX).
For each basic starting structure and underlying, we backtested between four and six different days-to-expiration (DTE) starting points for our trades:
- 24 DTE
- 31 DTE
- 38 DTE
- 52 DTE
- 66 DTE
- 80 DTE
For each of these DTE starting points tested, we looked at variations where the starting short strikes were 8 delta, 12 delta, 16 delta, and 20 delta. We now have a solid understanding of how each structure/underlying/DTE/delta combination performed between 2007 and mid-2014 when traded in a "no touch" manner.
With this post, we will start to explore dynamic exits from the different versions and variations of IC that we have tested so far. There are a number of approaches that we can take to exit a trade, including:
- Price Movement Exit - for example, if the market moves past the short strike of our put spread
- Margin Loss % Exit - for example, if the loss on our position has exceeded 40% of the position margin
- Initial Credit % Loss Exit - for example, close the position for a loss if the P&L reaches 50% of the initial credit.
- Initial Credit % Profit Exit - for example, close the position for a profit if the P&L reaches 60% of the initial credit.
I could go on, but you get the idea. At a minimum, we will backtest the above exits on some of our starting structure/underlying/DTE/delta combinations.
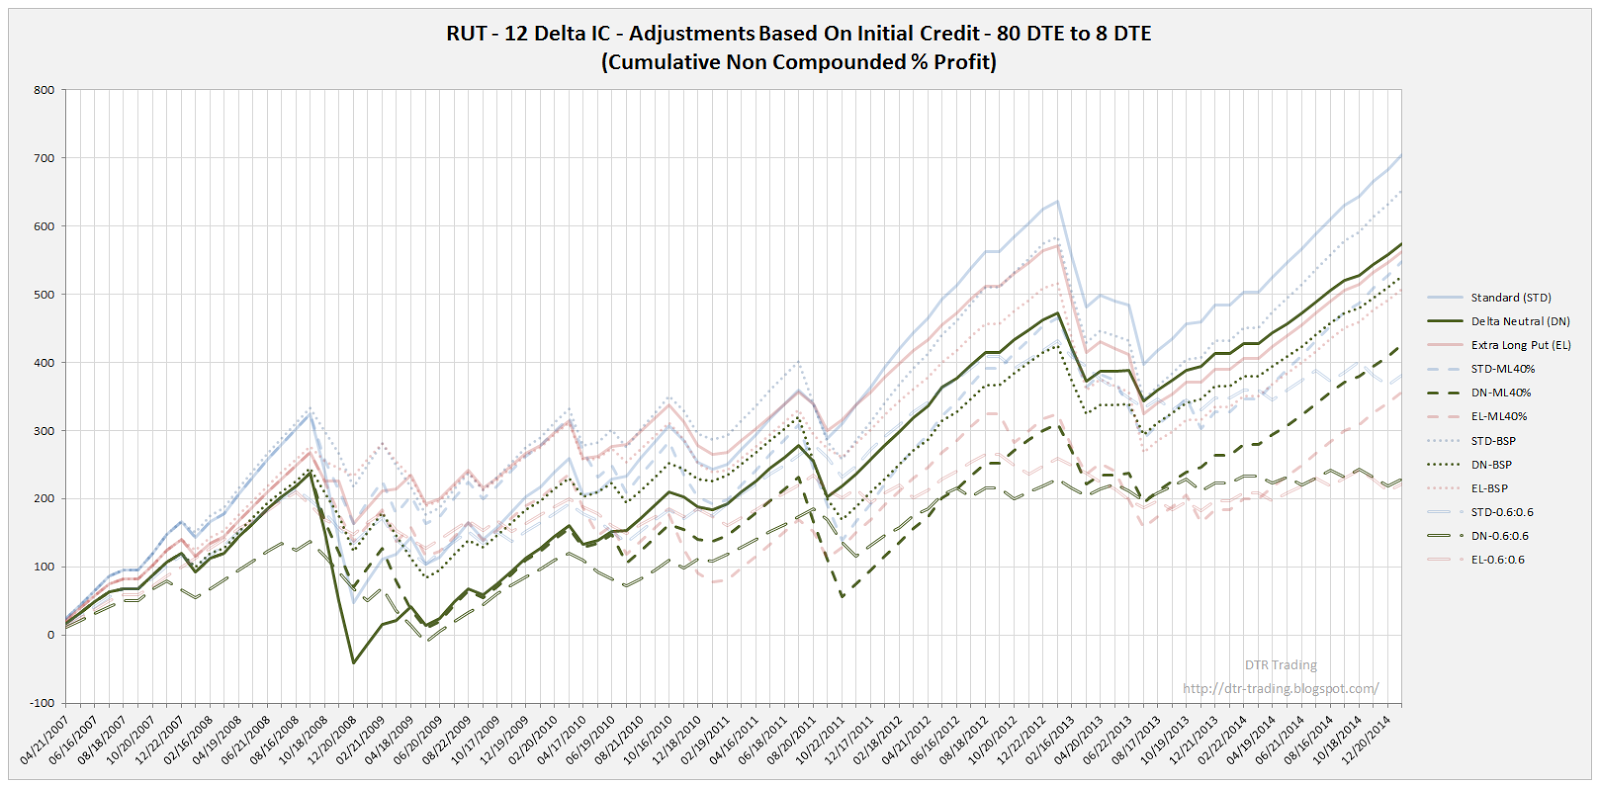
To see how these exits perform, I have included a chart showing the equity curves (in percent terms) for the three starting structures (Standard [STD], Delta Neutral [DN], Extra Long Put [EL]) on the RUT at 80 DTE for the 12 delta short variation. I have updated my historical options data through Friday, so these backtests start on January 1, 2007 and run through this month's expiration.
 |
| (click to enlarge) |
This equity curve chart should look very similar to the equity curves in my prior posts, except for the fact that this chart is in percent rather than dollars...in order to more easily compare the different curves. In the chart above, all of the STD IC versions have blue equity curves, all of the DN IC versions have green equity curves, and all of the EL IC versions have red equity curves. The solid lines represent the equity curves for the "no touch" version, while the dashed lines represent the equity curves for the dynamically exited versions.
There are three different exit versions shown in the chart above:
- ML40% - this is a Margin Loss % Exit. Trades using this exit strategy either exit at 8 DTE OR if the trade has a loss greater than 40% of the margin requirement for the trade. (ML40% = Max Loss 40%)
- BSP - this is a Price Movement Exit. Trades using this exit strategy either exit at 8 DTE OR if the price of the underlying (RUT) moves below the strike of the short put. (BSP = Below Short Put).
- 0.6:0.6 - This is an Initial Credit % Profit/Loss Exit. Trades using this exit strategy either exit at 8 DTE OR if the trade has a profit of 60% of its initial credit OR if the trade has a loss of 60% of its initial credit.
In the chart below, I have highlighted just the Standard IC (STD) versions. The STD version without dynamic stops has the largest overall performance of the STD strategies, followed by the BSP exit, the ML40% exit, and finally the 0.6:0.6 exit.
 |
| (click to enlarge) |
In the next chart, I have highlighted just the Delta Neutral IC (DN) versions. The DN version without dynamic stops has the largest overall performance of the DN strategies, followed by the BSP exit, the ML40% exit, and finally the 0.6:0.6 exit...the same pattern we noticed in the STD strategies.
 |
| (click to enlarge) |
In this last chart, I have highlighted just the Extra Long Put IC (EL) versions. The EL version without dynamic stops has the largest overall performance of the EL strategies, followed by the BSP exit, the ML40% exit, and finally the 0.6:0.6 exit...the same pattern we noticed in the STD and DN strategies.
 |
| (click to enlarge) |
There are at least two points to note in the above charts. The first is that the STD strategy without dynamic exits has the best overall performance. The second, is that the percentages have not been normalized...the margin requirement for every trade is different. Therefore the denominator is different for every percent return. If we normalize the percentages using the maximum margin required for all 1128 trades represented in the above equity curves....which happens to be $17,700...we get the normalized equity curve chart below. This chart does not look to different from the non-normalized chart.
 |
| (click to enlarge) |
In the next post I will provide a similar overview for the 66 DTE IC versions.
If you don't want to miss my new blog posts, follow my blog either by email or by RSS feed. Both options are free, and are available on the top of the right hand navigation column under the headings "Follow By Email" and "Subscribe To RSS Feed". I follow blogs by RSS using Feedly, but any RSS reader will work.
3 comments:
These are very interesting results - good work! I am very surprised that the exit based strategies were not close to the no touch versions. And I would expect the draw downs to be less on the exit based strategies, but they look nearly as large as the no touch versions. I know you could turn this into a never ending set of tests, but I'd be interested if some other threshold, like 50% instead of 60% would work out better. Looking forward to your future test results. Would really like to find a version with less dramatic DDs.
Thanks for you comment.
I think there are several explanations for the negative impact of the exits on the returns, but these explanations all have a common variable, the tendency of the RUT to mean-revert over the life of the trade (72 days). You'll see the mean-reversion impact become less on the 66 DTE trades.
By the way, you see stops having a similar impact on non-option based strategies as well. Often, stops will reduce the profit potential of equity based systems...I've seen this with my own rotation based systems.
After a several months of posts exploring dynamic exits, I will move on to intra-trade adjustments...you'll see the drawdowns reduced in those tests.
Thanks again,
Dave
Thank you for the great work on this. I've been beginning to start trading SPX IC's and this helps take some guess work out of it as I'm not capable of setting up backtests with options.
Just out of curiosity, what type of rotation based system are you referring to? Rotations within ETF asset classes?
Post a Comment