This post reviews the backtest results for 4120 options straddles sold on the RUT at 59 days-to-expiration (DTE). Eight different loss approaches were tested on these straddles. On top of these eight loss approaches, tests were conducted with no profit taking, and profit taking at 10%, 25%, 35%, and 45% of the credit received. In future articles, the performance of trades initiated at other DTE (66, 73, and 80) will be explored. You can find the prior RUT straddle summary posts at the links below:
- RUT Straddle - 38 DTE - Results Summary
- RUT Straddle - 45 DTE - Results Summary
- RUT Straddle - 52 DTE - Results Summary
The results in this post are summarized in six heat map tables. In these tables, each row corresponds to a different loss exit percentage. For example, the first row (25) corresponds to the strategy variations where losses were taken at 25% of the credit received. These rows have values from 25 to 200. The columns are a little more complicated, and are grouped first by IV rank (IVR) level, and then by profit exit percentage. You can see that each IVR percentage level contains five columns (10, 25, 35, 45, and NA)...with each column representing a profit taking percentage. For example, the first column lists all of the strategy variations where the IVR was less than 25% and profits were taken at 10% of the credit received.
The first table shows the average normalized P&L per day by IVR, profit taking percentage, and loss taking percentage. These 59 DTE tests were typical of past tests, in that the IVR > 50% group outperformed the other IVR groups in terms of P&L per day. This out-performance was strongest at the loss taking levels of 50% and 75%, and this pattern spanned several IVR groupings. The highest daily returns were concentrated in the IVR > 50% group, with profit taking at 25% and loss taking at 50% and 75%.
 |
| (click to enlarge) |
The second table shows the average P&L per trade by IVR, profit taking percentage, and loss taking percentage. The relative under-performance of the 10% profit taking level is striking in this table. We typically see this profit taking level under-perform in P&L per trade readings, but not by such a large amount. The IVR > 50% level showed the highest P&L per trade readings. The highest readings were at loss taking levels of 50% and 75% and carried to expiration...no profit taking threshold. The loss taking levels of 50% and 75% showed strength across IVR groups.
 |
| (click to enlarge) |
The third table shows the win percent / win rate by IVR, profit taking percentage, and loss taking percentage. The highest win rates occur at lower profit taking levels...the lower the profit taking percentage, the higher the win rate for a given IVR grouping. The highest win rates occur with profit taking at 10%, which is a consistent pattern across both the RUT and SPX straddle tests. The highest win rates in the table below, are some of the highest we've seen across the RUT straddle tests.
 |
| (click to enlarge) |
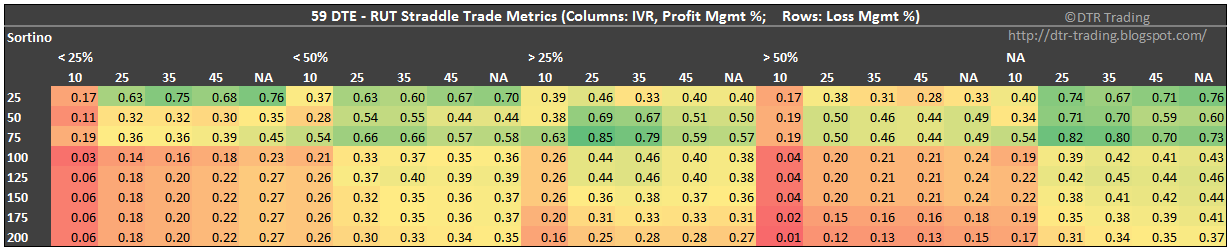
In the fourth table, we see the Sortino Ratio by IVR, profit taking percentage, and loss taking percentage. There are two patterns in this table that are interesting. The first, is that the the highest Sortino Ratios are concentrated in the low loss taking levels of 25%, 50%, and 75%. In this band, the greatest region of strength appears in the non-IVR filtered group (NA).
 |
| (click to enlarge) |
The fifth table shows the profit factor by IVR, profit taking percentage, and loss taking percentage. There is again an region of strength with loss taking levels of 25%, 50%, and 75%.
 |
| (click to enlarge) |
The last table shows the average days-in-trade (DIT) by IVR, profit taking percentage, and loss taking percentage. Quicker profit taking, translates into shorter time in the trade. In general, the higher the DTE and trade initiation, the longer it will take to reach the desired profit taking level.
 |
| (click to enlarge) |
Which variation of the 59 DTE straddle is best? If I was going to sell a 59 DTE ATM RUT straddle every month, I would likely go with the non-IVR filtered variation ... taking profits at 25%, with a loss threshold of 75%. This would put my gains at 1/3 my losses (25/75), and a win rate at approximately 86%. For the (75:25) variation, the average P&L per day is 0.59% and the average P&L per trade is 20%, measured in terms of margin required. When the IVR goes above 50% (at trade entry for new trades), I would increase position size and keep the profit and loss exits the same.
You can find links to all of my RUT straddle articles, and RUT straddle tweets on the RUT Straddle Summary Page. In the next post, we will look at the automated backtest results for the short straddle on the RUT at 66 DTE.
Follow my blog by email, RSS feed or Twitter (@DTRTrading). All options are available on the top of the right hand navigation column under the headings "Subscribe To RSS Feed", "Follow By Email", and "Twitter".
No comments:
Post a Comment