CustomMenu

Thursday, May 28, 2015

SPX Iron Condor - High Loss Threshold - 80 DTE

This post looks at a standard (STD) one-lot iron condor on the S&P 500 Index (SPX), initiated at 80 days-to-expiration (DTE).  The results in this post were derived from approximately 3200 individual trades entered by the backtester.

For background on the setup for the backtests, as well as the nomenclature used in the charts and tables below, please see the introductory article for this series: Iron Condor Series - Higher Loss Thresholds

In the trade metrics tables, I have highlighted some of the metrics rows to indicate values that are in the upper half of the readings.  One of the metrics to note is the average P&L per day in percentage terms (Trade Details (%) - Avg. P&L / Day).  This is a measure of the P&L per day normalized to the maximum margin required for that trade run...it tells us the effectiveness of theta with respect to our margin requirement.

8 Delta Short Strikes
Iron Condor Equity Curves SPX 80 DTE 8 Delta Risk:Reward Exits
(click to enlarge)
Iron Condor Trade Metrics SPX 80 DTE 8 Delta Risk:Reward Exits
(click to enlarge)
For the 80 DTE, 8 delta SPX iron condors, the top exit approaches indicated by the metrics were: NA%:50%, 300%:50%, and 300%:75%.


12 Delta Short Strikes
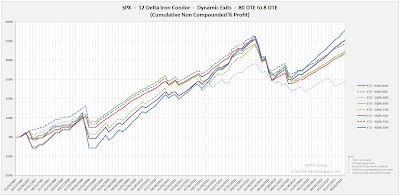
Iron Condor Equity Curves SPX 80 DTE 12 Delta Risk:Reward Exits
(click to enlarge)
Iron Condor Trade Metrics SPX 80 DTE 12 Delta Risk:Reward Exits
(click to enlarge)
For the 80 DTE, 12 delta SPX iron condors, the top exit approaches indicated by the metrics were: NA%:50%, 200%:50%, and 200%:75%.


16 Delta Short Strikes
Iron Condor Equity Curves SPX 80 DTE 16 Delta Risk:Reward Exits
(click to enlarge)
Iron Condor Trade Metrics SPX 80 DTE 16 Delta Risk:Reward Exits
(click to enlarge)
For the 80 DTE, 16 delta SPX iron condors, the top exit approaches indicated by the metrics were: NA%:50%, 300%:50%, and 400%:50%.


20 Delta Short Strikes
Iron Condor Equity Curves SPX 80 DTE 20 Delta Risk:Reward Exits
(click to enlarge)
Iron Condor Trade Metrics SPX 80 DTE 20 Delta Risk:Reward Exits
(click to enlarge)
For the 80 DTE, 20 delta SPX iron condors, the top exit approaches indicated by the metrics were: NA%:50%, 300%:50%, and 400%:50%.

With the 80 DTE tests, the highest average P&L per day readings occurred with the 8 delta short strike variations.  In the next post I will summarize the results from the last four blog posts.


If you don't want to miss my new blog posts, follow my blog either by email, RSS feed or by Twitter.  All options are free, and are available on the top of the right hand navigation column under the headings "Subscribe To RSS Feed", "Follow By Email", and "Twitter".  I follow blogs by RSS using Feedly, but any RSS reader will work.

Monday, May 25, 2015

SPX Iron Condor - High Loss Threshold - 66 DTE

This post looks at a standard (STD) one-lot iron condor on the S&P 500 Index (SPX), initiated at 66 days-to-expiration (DTE).  The results in this post were derived from approximately 3200 individual trades entered by the backtester.

For background on the setup for the backtests, as well as the nomenclature used in the charts and tables below, please see the introductory article for this series: Iron Condor Series - Higher Loss Thresholds

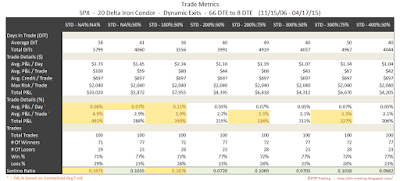
In the trade metrics tables, I have highlighted some of the metrics rows to indicate values that are in the upper half of the readings.  One of the metrics to note is the average P&L per day in percentage terms (Trade Details (%) - Avg. P&L / Day).  This is a measure of the P&L per day normalized to the maximum margin required for that trade run...it tells us the effectiveness of theta with respect to our margin requirement.

8 Delta Short Strikes
Iron Condor Equity Curves SPX 66 DTE 8 Delta Risk:Reward Exits
(click to enlarge)
Iron Condor Trade Metrics SPX 66 DTE 8 Delta Risk:Reward Exits
(click to enlarge)

For the 66 DTE, 8 delta SPX iron condors, the top exit approaches indicated by the metrics were: 200%:75%, and 300%:75%.


12 Delta Short Strikes
Iron Condor Equity Curves SPX 66 DTE 12 Delta Risk:Reward Exits
(click to enlarge)
Iron Condor Trade Metrics SPX 66 DTE 12 Delta Risk:Reward Exits
(click to enlarge)
For the 66 DTE, 12 delta SPX iron condors, the top exit approaches indicated by the metrics were: NA%:50%, 100%:50%, and 200%:50%.


16 Delta Short Strikes
Iron Condor Equity Curves SPX 66 DTE 16 Delta Risk:Reward Exits
(click to enlarge)
Iron Condor Trade Metrics SPX 66 DTE 16 Delta Risk:Reward Exits
(click to enlarge)
For the 66 DTE, 16 delta SPX iron condors, the top exit approaches indicated by the metrics were: NA%:NA%, NA%:50%, and 100%:50%.


20 Delta Short Strikes
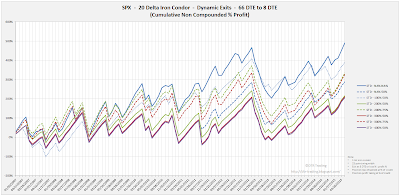
Iron Condor Equity Curves SPX 66 DTE 20 Delta Risk:Reward Exits
(click to enlarge)
Iron Condor Trade Metrics SPX 66 DTE 20 Delta Risk:Reward Exits
(click to enlarge)
For the 66 DTE, 20 delta SPX iron condors, the top exit approaches indicated by the metrics were: NA%:NA%, and 100%:50%.

With the 66 DTE tests, the highest average P&L per day readings occurred with the 8 delta short strike variations.  In the next post we will look at these same deltas and exits, but on the SPX 80 DTE iron condor.


If you don't want to miss my new blog posts, follow my blog either by email, RSS feed or by Twitter.  All options are free, and are available on the top of the right hand navigation column under the headings "Subscribe To RSS Feed", "Follow By Email", and "Twitter".  I follow blogs by RSS using Feedly, but any RSS reader will work.

Thursday, May 21, 2015

SPX Iron Condor - High Loss Threshold - 52 DTE

This post looks at a standard (STD) one-lot iron condor on the S&P 500 Index (SPX), initiated at 52 days-to-expiration (DTE).  The results in this post were derived from approximately 3200 individual trades entered by the backtester.

For background on the setup for the backtests, as well as the nomenclature used in the charts and tables below, please see the introductory article for this series: Iron Condor Series - Higher Loss Thresholds

In the trade metrics tables, I have highlighted some of the metrics rows to indicate values that are in the upper half of the readings.  One of the metrics to note is the average P&L per day in percentage terms (Trade Details (%) - Avg. P&L / Day).  This is a measure of the P&L per day normalized to the maximum margin required for that trade run...it tells us the effectiveness of theta with respect to our margin requirement.

8 Delta Short Strikes
Iron Condor Equity Curves SPX 52 DTE 8 Delta Risk:Reward Exits
(click to enlarge)
Iron Condor Trade Metrics SPX 52 DTE 8 Delta Risk:Reward Exits
(click to enlarge)
For the 52 DTE, 8 delta SPX iron condors, the top exit approaches indicated by the metrics were: 100%:50%, and 400%:50%.


12 Delta Short Strikes
Iron Condor Equity Curves SPX 52 DTE 12 Delta Risk:Reward Exits
(click to enlarge)
Iron Condor Trade Metrics SPX 52 DTE 12 Delta Risk:Reward Exits
(click to enlarge)
For the 52 DTE, 12 delta SPX iron condors, the top exit approaches indicated by the metrics were: NA%:50%, 300%:75%, and 400%:50%.


16 Delta Short Strikes
Iron Condor Equity Curves SPX 52 DTE 16 Delta Risk:Reward Exits
(click to enlarge)
Iron Condor Trade Metrics SPX 52 DTE 16 Delta Risk:Reward Exits
(click to enlarge)
For the 52 DTE, 16 delta SPX iron condors, the top exit approaches indicated by the metrics were: NA%:50%, 300%:50%, and 400%:50%.  Note: NA%:50% and 400%:50% have identical equity curves in the chart above.


20 Delta Short Strikes
Iron Condor Equity Curves SPX 52 DTE 20 Delta Risk:Reward Exits
(click to enlarge)
Iron Condor Trade Metrics SPX 52 DTE 20 Delta Risk:Reward Exits
(click to enlarge)
For the 52 DTE, 20 delta SPX iron condors, the top exit approaches indicated by the metrics were: NA%:50%, and 400%:50%.

With the 52 DTE tests, the highest average P&L per day readings occurred with the 12 delta short strike variations.  In the next post we will look at these same deltas and exits, but on the SPX 66 DTE iron condor.


If you don't want to miss my new blog posts, follow my blog either by email, RSS feed or by Twitter.  All options are free, and are available on the top of the right hand navigation column under the headings "Subscribe To RSS Feed", "Follow By Email", and "Twitter".  I follow blogs by RSS using Feedly, but any RSS reader will work.

Tuesday, May 19, 2015

SPX Iron Condor - High Loss Threshold - 38 DTE

This is the first article in a series where we will look at the performance of the iron condor options strategy, where the loss exits will be greater than the profit exits.  For background on the setup for the backtests, as well as the nomenclature used in the charts and tables below, please see the introductory article for this series: Iron Condor Series - Higher Loss Thresholds

This post looks at a standard (STD) one-lot iron condor on the S&P 500 Index (SPX), initiated at 38 days-to-expiration (DTE).  The results displayed below represent data from approximately 3200 individual trades entered by the backtester.  The results are separated by the delta of the short strikes.

In the trade metrics tables, I have highlighted some of the metrics rows to indicate values that are in the upper half of the readings.  One of the metrics to note is the average P&L per day in percentage terms (Trade Details (%) - Avg. P&L / Day).  This is a measure of the P&L per day normalized to the maximum margin required for that trade run...it tells us the effectiveness of theta with respect to our margin requirement.

8 Delta Short Strikes
Iron Condor Equity Curves SPX 38 DTE 8 Delta Risk:Reward Exits
(click to enlarge)
Iron Condor Trade Metrics SPX 38 DTE 8 Delta Risk:Reward Exits
(click to enlarge)
For the 38 DTE, 8 delta SPX iron condors, the top exit approaches indicated by the metrics were: 100%:50%, 200%:50%, 200%:75% and 300%:75%.


12 Delta Short Strikes
Iron Condor Equity Curves SPX 38 DTE 12 Delta Risk:Reward Exits
(click to enlarge)
Iron Condor Trade Metrics SPX 38 DTE 12 Delta Risk:Reward Exits
(click to enlarge)
For the 38 DTE, 12 delta SPX iron condors, the top exit approaches indicated by the metrics were: 200%:50% and 200%:75%.


16 Delta Short Strikes
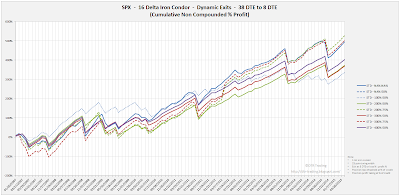
Iron Condor Equity Curves SPX 38 DTE 16 Delta Risk:Reward Exits
(click to enlarge)
Iron Condor Trade Metrics SPX 38 DTE 16 Delta Risk:Reward Exits
(click to enlarge)
For the 38 DTE, 16 delta SPX iron condors, the top exit approaches indicated by the metrics were: NA%:NA%, 200%:75%, and 300%:75%.


20 Delta Short Strikes
Iron Condor Equity Curves SPX 38 DTE 20 Delta Risk:Reward Exits
(click to enlarge)
Iron Condor Trade Metrics SPX 38 DTE 20 Delta Risk:Reward Exits
(click to enlarge)
For the 38 DTE, 20 delta SPX iron condors, the top exit approaches indicated by the metrics were: NA%:50%, 100%:50%, 300%:50% and 400%:50%.

In the next post we will look at these same deltas and exits, but on the SPX 52 DTE iron condor.


If you don't want to miss my new blog posts, follow my blog either by email, RSS feed or by Twitter.  All options are free, and are available on the top of the right hand navigation column under the headings "Subscribe To RSS Feed", "Follow By Email", and "Twitter".  I follow blogs by RSS using Feedly, but any RSS reader will work.

Monday, May 18, 2015

Iron Condor Series - Higher Loss Thresholds

During my series on dynamic exits of iron condors, I received several requests for an expansion of these backtests.  Specifically, people asked if I could run the tests with larger loss thresholds.  I thought this was a good idea.  I've decided to postpone the series on the Strangle options strategy, and instead spend the next five or six weeks looking at iron condors with higher loss thresholds.

For this new series, we will look the following:

(click to enlarge)

As with the prior series, these iron condors will be entered at four different days-to-expiration (DTE): 38 , 52 , 66 , and 80.  For each of these DTE, we will test iron condors with short strikes at four different delta: 8, 12, 16, and 20.

The core of this series is related to the exits.  The following 8 exits will be tested:
  1. STD - NA%:NA% - exit at 8 DTE.
  2. STD - NA%:50% - exit if the trade has a profit of 50% of its initial credit OR 8 DTE.
  3. STD - 100%:50% - exit if the trade has a loss of 100% of its initial credit OR if the trade has a profit of 50% of its initial credit OR 8 DTE.
  4. STD - 200%:50% - exit if the trade has a loss of 200% of its initial credit OR if the trade has a profit of 50% of its initial credit OR 8 DTE.
  5. STD - 200%:75% - exit if the trade has a loss of 200% of its initial credit OR if the trade has a profit of 75% of its initial credit OR 8 DTE.
  6. STD - 300%:50% - exit if the trade has a loss of 300% of its initial credit OR if the trade has a profit of 50% of its initial credit OR 8 DTE.
  7. STD - 300%:75% - exit if the trade has a loss of 300% of its initial credit OR if the trade has a profit of 75% of its initial credit OR 8 DTE.
  8. STD - 400%:50% - exit if the trade has a loss of 400% of its initial credit OR if the trade has a profit of 50% of its initial credit OR 8 DTE.
To clarify how these exits function, let's look at an example of the STD-200%:50% variation.  If we sell a 1-lot iron condor for $200, we would take our loss when the condor had to be bought back at $600.  $600 - $200 = $400, or a loss of 200% or our initial credit.  For this example, our profit taking would occur when we could buy back the iron condor for $100.  $200 - $100 = $100, or 50% or our initial credit.  

These exits can also be thought of as risk:reward exits.  Using the prior example of the STD-200%:50%, we are risking 200% to make 50%.  These odds don't sound great from a classical stock strategy approach, but the win rate and probabilities of exit are key components of options strategy profitability.


If you don't want to miss my new blog posts, follow my blog either by email, RSS feed or by Twitter.  All options are free, and are available on the top of the right hand navigation column under the headings "Subscribe To RSS Feed", "Follow By Email", and "Twitter".  I follow blogs by RSS using Feedly, but any RSS reader will work.

Wednesday, May 13, 2015

Which Iron Condor Options Strategy Is Best?

Over the last four months of blog posts we've looked at 7 different approaches for exiting iron condors.  These exits included:
  1. Exit at 8 DTE
  2. ML40% - exit when the loss is equivalent to 40% of the margin for the position OR 8 DTE
  3. BSP - exit when the market is below the strike of the short put (BSP) OR 8 DTE
  4. 0.6:0.6 - exit if the trade has a loss of 60% of its initial credit OR if the trade has a profit of 60% of its initial credit OR 8 DTE
  5. 0.6:0.9 - exit if the trade has a loss of 60% of its initial credit OR if the trade has a profit of 90% of its initial credit OR 8 DTE
  6. 0.7:0.9 - exit if the trade has a loss of 70% of its initial credit OR if the trade has a profit of 90% of its initial credit OR 8 DTE
  7. 0.8:0.9 - exit if the trade has a loss of 80% of its initial credit OR if the trade has a profit of 90% of its initial credit OR 8 DTE
We applied these exits to iron condors with different delta short strikes (8, 12, 16, and 20 delta) at different days to expiration (38, 52, 66, and 80) on 3 different starting structures of iron condor:

  1. Standard (STD) - an iron condor with an equal number of put and call credit spreads.
  2. Delta Neutral (DN) - an iron condor with fewer call credit spreads than put credit spreads in order to create a position delta near 0.  This structure performs better in an advancing market.
  3. Extra Long Put (EL) - a Standard iron condor with one additional long put for every 10 put credit spreads.  This structure performs better in a declining market.

So how did each of these variations perform?  Let's review the equity curves for all of the combinations listed above, to get a qualitative sense of the performance.  Recall that the y-axis scale is the same for all of the equity curves (0% - 1000%), except for the 16 and 20 delta variations of the 66 DTE trade (0% - 1400%).


Iron Condor Dynamic Exit Equity Curves RUT 38 DTE 8, 12, 16, and 20 Delta
Iron Condor Dynamic Exit Equity Curves RUT 52 DTE 8, 12, 16, and 20 Delta
Iron Condor Dynamic Exit Equity Curves RUT 66 DTE 8, 12, 16, and 20 Delta
Iron Condor Dynamic Exit Equity Curves RUT 80 DTE 8, 12, 16, and 20 Delta


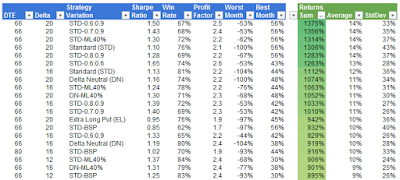
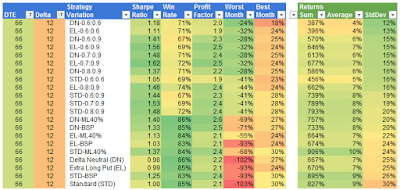
With these equity curve images in our minds, let's look at the trade metrics.  The three tables below show the top 20 strategy variations (out of 336) in terms of selected metrics.

Iron Condor Dynamic Exit Sharpe Ratios
(click to enlarge)
This first table shows the top 20 Sharpe Ratios, which range from 1.41 to 1.84.  Of these top 20, 19 are at 66 DTE, with a strong leaning toward the 8 delta short strike variations.  The top five are dominated by the DN and STD variations using loss:profit exits of 0.6:0.9, 0.7:0.9, and 0.8:0.9.

Iron Condor Dynamic Exit Win Rates
(click to enlarge)
The second table shows the top 20 strategies ordered by highest win rate, ranging from 86% to 89%.  The top win rates are heavily dominated by the 8 delta short strike variations...not a surprise.  Of these top 20, 11 went to the 66 DTE variations and 8 went to the 80 DTE variations.  Again, not a surprise, since at these higher DTE, the short strikes are further from at-the-money.  The top performers did not exit using profit or loss based on the credit received.  They either used no dynamic exit (exited at 8 DTE), or the BSP or ML40% exits.  If you can stomach unrealized losses in your iron condor positions, they seem to turn around and become profitable more often than not.

Iron Condor Dynamic Exit Profit Factors
(click to enlarge)
The last of these three tables shows the top 20 strategies ordered by highest profit factor, ranging from 2.4 to 2.9.  Recall that the profit factor is just the sum of the profits divided by the sum of the losses.  All of the top 20 belong to the 66 DTE variations.  Of these top 20, the top 8 are all 8 delta variations (3 STD and 5 DN).  The loss:profit exits of 0.6:0.9, 0.8:0.9, and 0.7:0.9 took the top five profit factor positions.

The next two tables show the top 20 strategy variations (out of 336) in terms of monthly return metrics.

Iron Condor Dynamic Exit Total Returns
(click to enlarge)
The top 20 strategies in terms of total returns are the 20 delta and 16 delta variations of the 66 DTE strategies.  This is not a surprise, since these strategies were the only ones that required an increase in the y-axis scale for their equity curves.  The STD starting structure took the top 7 positions of the top 20.  The top 6 positions were the 20 delta variations: STD-0.6:0.9, STD-0.7:0.9, STD-ML40%, STD, STD-0.8:0.0, STD:0.6:0.6.

Iron Condor Dynamic Exit Standard Deviation of Monthly Returns
(click to enlarge)
The 20 strategies with the lowest standard deviation of monthly returns are dominated by the 8 delta strategies, with standard deviations ranging from 7% to 10%.  These 20 are dominated by the modified starting structures (EL and DN), and taking profits and losses early 0.6:0.6.  9 of the top 20 are starting at 38 DTE.

So, which iron condor strategy is best?  That depends on your goal:
  • Want a high Sharpe Ratio and high profit factor - go with a 66 DTE, 8 delta short strike, using either a DN or STD starting structure.  Then use a loss:profit exit of 0.6:0.9, 0.7:0.9 or 0.8:0.9.  Historically, this approach produced an average profit per trade of about 5%, with a worst month loss of around 20%.

  • Want a high win rate - go with a 66 DTE, 8 delta short strike, using a DN starting structure.  Then either let the position go to 8 DTE with no intermediate exit or use the BSP or ML40% exit.  Historically, this approach produced an average profit per trade of about 6%, but be prepared for larger drawdowns in the 50% to 90% range.

  • Want the highest returns / return per trade - go with the 66 DTE, 20 delta short strike, using the STD starting structure.  Then use a loss:profit exit of 0.6:0.9, 0.7:0.9, or 0.8:0.9.  Historically, this approach produced an average profit per trade of about 14%, with worst month losses in the 50% to 60% range.  With this approach, you would have had a profit factor over 2 and a Sharpe over 1.

  • Want a low standard deviation of returns - go with a 38 DTE, 8 delta short strike using either the EL or DN starting structure.  Then use a loss:profit exit of 0.6:0.6.  Historically, this approach produced an average profit per trade of about 2% or 3%, with a worst month loss in the high teens.

Of all of the 336 strategy variations, my preference is for the 66 DTE, 12 delta short strike, using the STD starting structure.  I like the results when this structure is managed with a loss:profit exit of either 0.6:0.9, 0.7:0.9, or 0.8:0.9...see below.

Iron Condor Dynamic Exit 66 DTE 12 Delta Trade Metrics
(click to enlarge)

All of the data in the tables above can be downloaded in spreadsheet form from Google Docs at:
http://dtr-trading.blogspot.com/p/dynamic-exit-iron-condor-statistics.html


If you don't want to miss my new blog posts, follow my blog either by email, RSS feed or by Twitter.  All options are free, and are available on the top of the right hand navigation column under the headings "Subscribe To RSS Feed", "Follow By Email", and "Twitter".  I follow blogs by RSS using Feedly, but any RSS reader will work.

Sunday, May 10, 2015

RUT Iron Condor - Dynamic Exit - 80 DTE Results Summary

Over the last several posts we reviewed the backtest results for Iron Condors initiated at 80 days to expiration (DTE) on the Russell 2000 Index (RUT).  To be consistent with all of the earlier backtests posted on this blog, we looked at 80 DTE Iron Condors initiated with short strikes at four different locations: 8 delta, 12 delta, 16 delta, and 20 delta. To read the prior dynamic exit posts, please visit the summary page: Dynamic Exit Iron Condor Articles.

For each of these four different short strike deltas, we tested three different starting structures, with six different dynamic exits.  These various combinations, resulted in 21 separate 8 year tests for each delta when also including the three baseline (non-exited) tests.  Lastly, each 8 year test contained 94 unique trades.

To review, the three RUT Iron Condor starting structures were composed of 20 point wide credit spreads with short strikes at the specified delta mentioned above, and defined as:
  • Standard (STD): 10 put credit spreads, and 10 call credit spreads.
  • Delta Neutral (DN): 10 put credit spreads, and from 5 to 10 call credit spreads - the number is adjusted at trade initiation to create a delta neutral Iron Condor.
  • Extra Long Put (EL): 10 put credit spreads, 10 call credit spreads, and 1 extra long put.
The three categories of dynamic exit tested were:
  • ML40% - this is a Margin Loss % Exit.  Trades using this exit strategy either exit at 8 DTE OR if the trade has a loss greater than 40% of the margin requirement for the trade. (ML40% = Max Loss 40%)
  • BSP - this is a Price Movement Exit.  Trades using this exit strategy either exit at 8 DTE OR if the price of the underlying (RUT) moves below the strike of the short put.  (BSP = Below Short Put).
  • 0.6:0.6 - This is an Initial Credit % Loss/Profit Exit. Trades using this exit strategy either exit at 8 DTE OR if the trade has a loss of 60% of its initial credit OR if the trade has a profit of 60% of its initial credit.  This can also be viewed as a Risk:Reward ratio; risking 60% of the credit to make 60% of the credit.  A 0.7:0.9 variation would mean that the strategy is risking 70% to make 90%...taking a loss at 70% of the initial credit or taking a profit at 90% of the initial credit or exiting at 8 DTE if neither of the prior two criteria were satisfied.
The test results are summarized in the tables below. with one table for each of the four short strike deltas.  The "Strategy Variation" column uses the nomenclature listed above in order to distinguish between the different iron condor variations.

Iron Condor Dynamic Exit Statistics RUT 80 DTE 8 Delta
(click to enlarge)
The pattern that we observed in the prior DTE tests, again holds true for the 80 DTE tests.  For the 8 delta Iron Condor options strategy variations, the win rates were highest with the non-dynamically exited, the ML40%, and the BSP versions.  You can also see the trend that the Initial Credit %Loss/Profit exits greatly reduced the "worst month" losses, with all of these losses either in the high teens or high 20% range.  This reduction in the "worst month" values came at the cost of a reduced the win rate.   The largest annualized monthly returns went to the STD, STD-ML40%, and STD-BSP variations.  Across each exit approach, the STD variations were the top performers in terms of average return...a pattern we observed in other DTE tests as well!


Iron Condor Dynamic Exit Statistics RUT 80 DTE 12 Delta
(click to enlarge)
For the 12 delta Iron Condor variations, the highest Sharpe Ratios occurred with the Profit/Loss exits of 0.6:0.9, 0.7:0.9, and 0.8:0.9.  The highest win rates and worst months went to the non-dynamically exited, the ML40% and BSP variations...the same pattern we noticed in the 8 delta strategies, and in the corresponding 38, 52, and 66 DTE strategies.  The largest annualized monthly returns went to the STD, STD-BSP, and STD-0.8:0.9 variations.


Iron Condor Dynamic Exit Statistics RUT 80 DTE 16 Delta
(click to enlarge)
The 16 delta variations continued the same win rate and worst month pattern that we observed in the 8 and 12 delta variations, although not as pronounced.  At 16 delta, we see the STD Profit/Loss exit variations have pretty bad worst month numbers.  The largest annualized monthly returns went to the STD-BSP variation, with the STD and the STD-0.6:0.9 variations in second and third place respectively.


Iron Condor Dynamic Exit Statistics RUT 80 DTE 20 Delta
(click to enlarge)
At 20 deltas, the worst month and win rate patterns were still present, although these patterns continued to break down.  The highest Sharpe Ratio was 0.96 and went to the STD-0.6:0.6 variation.  The largest annualized monthly returns went to the STD-0.6:0.9 variation, followed by the STD and STD-ML40% variations.

Across all of the 80 DTE Iron Condor strategy variations, it is clear that the Risk:Reward exits had a significant positive impact on the "worst month" values.  One pattern that was fairly clear at 80 DTE (as well as other DTE) was the general out-performance of the STD structure over the DN and EL structures.  If I was forced to trade one of these 80 DTE strategies "as is" with no adjustments, I would pick one of the 8 or 12 delta strategies using a risk:reward exit, likely one of the STD-0.8:0.9 or STD-07:0.9 variations...the same variations I chose at 66 DTE.

All of the data in the tables above can be downloaded in spreadsheet form from Google Docs at:
http://dtr-trading.blogspot.com/p/dynamic-exit-iron-condor-statistics.html


If you don't want to miss my new blog posts, follow my blog either by email, RSS feed or by Twitter.  All options are free, and are available on the top of the right hand navigation column under the headings "Subscribe To RSS Feed", "Follow By Email", and "Twitter".  I follow blogs by RSS using Feedly, but any RSS reader will work.

Friday, May 8, 2015

RUT Iron Condor - Dynamic Exit - 80 DTE - 20 Delta Continued

This post is a continuation of the prior post. In this post we will look at the backtest results for dynamic exits of the 80 days-to-expiration (DTE) Iron Condor (IC), with 20 delta short strikes, with different profit and loss exits as a percentage of the initial credit.  Recall that these RUT ICs were all constructed with 20 point wide credit spreads.  This is a non-directional options trading strategy that seeks to profit from a market that stays within a range between the two short strikes of the Iron Condor.

For some background on how the results are presented and to read my prior dynamic exit posts, please visit the summary page: Dynamic Exit Iron Condor Articles.

As discussed in the two overview posts on the summary page above, we will look at the same three Iron Condor starting structures that have been backtested on this blog: Standard (STD), Delta Neutral (DN), and Extra Long Put (EL).

In this post we will only look at the Initial Credit % Profit/Loss Exit on each of the three starting structures:
  • 0.6:0.9 - This is an Initial Credit % Profit/Loss Exit. Trades using this exit strategy either exit at 8 DTE OR if the trade has a profit of 90% of its initial credit OR if the trade has a loss of 60% of its initial credit.  This can also be thought of as risk:reward; risking 60% to make 90%.

This equity curve chart below is similar to the equity curves in my prior posts.  In the chart below, all of the STD Iron Condor versions have blue equity curves, all of the DN Iron Condor versions have green equity curves, and all of the EL Iron Condor versions have red equity curves.  The solid lines represent the equity curves for the "no touch" version, while the dashed lines represent the equity curves for the dynamically exited versions.


Iron Condor Dynamic Exit Equity Curves RUT 80 DTE 20 Delta Risk:Reward Versions
(click to enlarge)

The dynamic exit versions tested were closed at either 8 DTE or a profit of 90% of the initial credit received.  The parameters that varied were the risk or loss amount.  The trades were closed for a loss if the loss was either 60%, 70%, or 80% of the initial credit received.  In these backtest results, the Standard Iron Condor options trading strategy (STD) versions did not outperform all of the Delta Neutral (DN) and Extra Long Put (EL) versions...two DN versions slipped into the third and fourth positions  The two top performers in terms of overall return were the STD-0.6:0.9  version, and the STD version without a dynamic exit respectively.  The STD-0.6:0.9 version closed at either 8 DTE, a profit of 90% of the initial credit received, or a loss of 60% of the initial credit received.

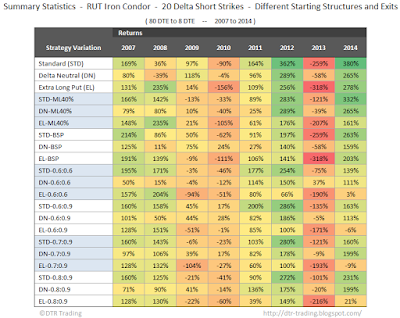
The results by year, for each of the 80 DTE, 20 delta short Iron Condor options trading strategy versions are shown in the table below.

Iron Condor Dynamic Exit Return Statistics RUT 80 DTE 20 Delta
(click to enlarge)

The details associated with each of the starting structure backtests can be found in the posts below:

In the next post I will summarize the dynamic exit results for the 80 DTE Iron Condor options trading strategies and show the associated trade statistics.

If you don't want to miss my new blog posts, follow my blog either by email, RSS feed or by Twitter.  All options are free, and are available on the top of the right hand navigation column under the headings "Subscribe To RSS Feed", "Follow By Email", and "Twitter".  I follow blogs by RSS using Feedly, but any RSS reader will work.

RUT Iron Condor - Dynamic Exit - 80 DTE - 20 Delta

We're just a few short posts from completing the dynamic exit series.  Thanks for hanging in there through this four month process chronicled here: Dynamic Exit Iron Condor Articles!

In this post we will look at the backtest results for dynamic exits of the 80 days-to-expiration (DTE) Iron Condor (IC) options strategy, with 20 delta short strikes, with different profit and loss exits.  This is a non-directional options trading strategy that seeks to profit from a market that stays within a range between the two short strikes of the Iron Condor.

For some background on how the results are presented and to read my prior dynamic exit posts, please visit the summary page: Dynamic Exit Iron Condor Articles.

As discussed in the two overview posts on the summary page above, we will look at the same three Iron Condor starting structures that have been backtested on this blog: Standard (STD), Delta Neutral (DN), and Extra Long Put (EL).

Also as discussed in the two overview posts, we will look at three different exits on each of these three starting structures:
  • ML40% - this is a Margin Loss % Exit.  Trades using this exit strategy either exit at 8 DTE OR if the trade has a loss greater than 40% of the margin requirement for the trade. (ML40% = Max Loss 40%)
  • BSP - this is a Price Movement Exit.  Trades using this exit strategy either exit at 8 DTE OR if the price of the underlying (RUT) moves below the strike of the short put.  (BSP = Below Short Put).
  • 0.6:0.6 - This is an Initial Credit % Profit/Loss Exit. Trades using this exit strategy either exit at 8 DTE OR if the trade has a profit of 60% of its initial credit OR if the trade has a loss of 60% of its initial credit.  This can also be thought of as risk:reward; risking 60% to make 60%.

This equity curve chart below is similar to the equity curves in my prior posts.  In the chart below, all of the STD Iron Condor versions have blue equity curves, all of the DN Iron Condor versions have green equity curves, and all of the EL Iron Condor versions have red equity curves.  The solid lines represent the equity curves for the "no touch" version, while the dashed lines represent the equity curves for the dynamically exited versions.


Iron Condor Dynamic Exit Equity Curves RUT 80 DTE 20 Delta All Versions
(click to enlarge)

The three highest overall returns went to the Standard (STD) Iron Condor variations in order:  STD without dynamic exits, STD-ML40%, and STD-0.6:0.6...the 20 delta results were similar to the 16 delta variation results.  The ML40% version closed at either 8 DTE or when the loss calculated on margin exceeded 40%.  The STD-0.6:0.6 version closed at either 8 DTE, a profit of 60% of the initial credit received, or a loss of 60% of the initial credit received.

The details associated with each of the starting structure backtests can be found in the posts below:

In the next post I will show the results for the 80 DTE, 20 delta short strike Iron Condor options trading strategy, with varying Initial Credit % Profit/Loss Exits.

If you don't want to miss my new blog posts, follow my blog either by email, RSS feed or by Twitter.  All options are free, and are available on the top of the right hand navigation column under the headings "Subscribe To RSS Feed", "Follow By Email", and "Twitter".  I follow blogs by RSS using Feedly, but any RSS reader will work.