At a high level, we tested 7 different days-to-expiration (DTE) for trade entry. For each of these DTE, we tested 8 different loss management levels (based on the credit received for selling the straddle). For each of these loss management levels, we tested 5 different profit management levels, again based on the credit received for selling the straddle. This comes out to 280 different tests for each monthly option expiration (7 x 8 x 5 = 280). We backtested all of the monthly options expirations starting in January 2007 and running through August 2015...a few more than 100 monthly options expirations...and that's how we got to the 28,840 trades. This does not include the 5 IVR filters that were tested (no filter, >25, <25, >50, <50) ... If I did, we'd need to multiply the 28,840 by 5.
Equity Curves
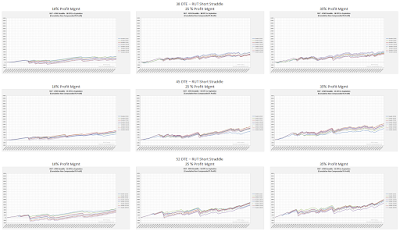
Enough of the intro, let's get into the results. Just like I've done in my prior full-summary posts, I'm including equity curves for each of the DTE. In the images below, each row is a separate DTE, starting with 38 DTE at the top, and ending with 80 DTE at the bottom. I am only including three profit taking levels (10%, 25%, and 35%) in order to fit a representative number of equity curves in this post. Also, note that the y-axis is the same across all 21 of the equity curves below.
 |
| (click to enlarge) |
So what can we learn from these equity curves...essentially the same things we learned from the SPX straddle equity curves. The trades with higher profit taking levels had the greatest returns for a given DTE. Also, the trades with the longer durations (higher DTE), in general had greater returns for a given profit taking level.
General Trends
For the RUT short option straddle articles I chose not to share the scatter plots. The trends that we noticed in the scatter plots for the SPX short option straddles were also present in the scatter plots for the RUT short option straddles. If you have an interest in seeing a particular scatter plot, let me know and I'll see what I can do...nothing very different from the SPX scatters though.
IV / IVR Scatter Plots
The higher the IV, or IVR, the larger the returns for a given trade. Our profit taking is tied to the credit received, and a higher IV or IVR will result in a larger credit compared to a trade entered at a lower IV or IVR. This also has an impact on our expiration break-even points for the trade, with a higher IV or IVR pushing our expiration break-even points further away from ATM.
IV Scatter Plots
Many trades were entered at an IV level between 15 and 40...both winning and losing trades. This also makes sense considering the range of the RVX.
DIT Scatter Plots
Another recurring pattern was that higher DTE and/or higher profit taking percentage, resulted in longer trade durations. This was expected, but it was nice to see that the data confirmed our intuition.
IVR Filtering
The most consistent IVR patterns were related to the IVR > 50% filter. In general, trades that met the IVR > 50% criteria had higher win rates, higher P&L readings, and higher profit factors. The downside? ...only about 20% of all potential trades met this IVR criteria ... so, only two or three trades per year. When you do see this filter criteria met, you should strongly consider increasing your size for these RUT short straddles.
Quantitative Results
In all of the tables below, I followed the same structure as the tables in the summary posts for the individual DTE. The only difference is that the heat map coloring below evaluates all of the data, so that we can visualize the strength of IVR filters, profit taking levels, and loss taking levels across the entire data set.
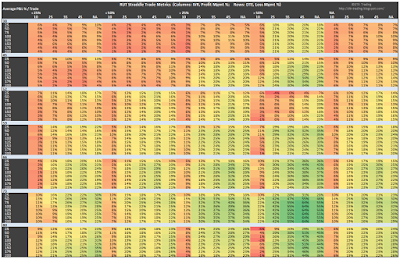
The first table shows the normalized percent P&L per day for all of the strategy variations. The variations that met the IVR > 50% filter had the highest readings. The highest readings for this group occurred at 73 DTE, with loss taking at 75% or greater, and profit taking ranging from 25% to 45%. As I mentioned above, you were only able to enter these IVR > 50% trades two or three times per year ... only two or three times per year did we see a RUT IVR level greater than 50% at trade entry.
When we evaluate these normalized P&L per day readings, we need to also consider how many days during the year we will generate these daily returns. Using IVR to filter our trade entries will dramatically reduce our annual DIT. Low profit taking levels and low loss taking levels will also reduce our annual DIT for a given DTE trade entry window...so all four (IVR, loss %, profit %, DTE) need to be considered when targeting a particular daily return.
 |
| (click to enlarge) |
The second table shows the normalized percent P&L per trade for all of the strategy variations. Again, we see the highest per trade returns associated with the variations that met the IVR > 50% filter, with the 73 DTE variations standing out. If we look at the non-IVR filtered variations (NA), we see return profiles similar to those of the SPX...although not quite as good. For traders who are executing these trades every month, this is the column to focus on.
 |
| (click to enlarge) |
The third table shows the win rate for all of the strategy variations. Similar to the SPX straddles, the highest win rates occurred at the 10% profit taking level...regardless of IVR filter level. Most of these particular win rates were in the 90% range. For the non-IVR filtered group (NA), many of the 10% profit taking variations also had win rates in the 90% range. For this same non-IVR filtered group, with entries from 59 DTE to 80 DTE, the 25% profit taking level was in the mid to high 80% range. For these 25% profit taking variations, the average P&L per trade numbers were in the mid to high teens...not the highest in the table, but very good for a monthly trade.
 |
| (click to enlarge) |
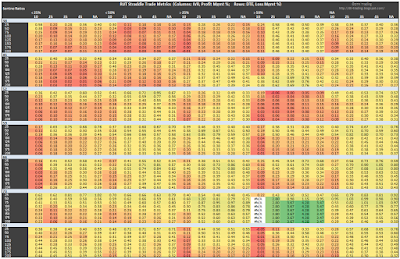
The fourth table shows Sortino Ratios for all of the strategy variations. The extreme readings for the 73 DTE variations in the IVR > 50% group really stand out...and tend to hide other readings that would normally be good for straddles (0.45 and higher). If we ignore this grouping, what we see are areas of strength at 59 DTE, 66 DTE, and 73 DTE at the loss taking levels of 25%, 50%, and 75% in the non-IVR filtered group (NA)...see secondary table below.
 |
| (click to enlarge) |
 |
| (click to enlarge) |
The fifth table shows the profit factors for each of the strategy variations. The extreme readings for the 73 DTE variations in the IVR > 50% group again overshadow the other results. If we ignore the results in this grouping, we see other regions of very strong profit factors...see secondary table below.
 |
| (click to enlarge) |
 |
| (click to enlarge) |
The sixth table shows days-in-trade (DIT) for each of the strategy variations. As we've see in all of my SPX and RUT straddle articles..the quicker you take profits or losses, the shorter your trade duration. Also, longer DTE variations required you to stay in your trades longer in order to hit your profit exit. In general, we can see in the table that, to collect 10% of the credit received (10% profit taking level) required a trade duration of roughly 30% of the entry DTE. At the 25% profit taking level you needed to stay in the trade around 60% of the entry DTE. For the 35% profit taking level it was about 70% of the entry DTE; 45% profit taking took your trade duration to about 80% of the entry DTE. These estimates are for the non-IVR filtered strategy variations and are consistent with the SPX straddle results.
 |
| (click to enlarge) |
The seventh table shows the number of trades that were entered for each strategy variation. The number of trades for a particular variation, along with the DIT (previous table) have a large impact on your portfolio returns. As soon as you apply an IVR filter to trade entry, you reduce the number of trades that you take...as seen in the table below. These results are also consistent with the SPX straddle results.
 |
| (click to enlarge) |
The last table shows the.total non-compounded normalized returns by strategy variation. The non-IVR filtered variations had the highest returns, which is related to these variations having the most trades (100+, see table above). In general, the trend is for higher returns with higher DTE...and is the same pattern that we noticed with the SPX straddles.
 |
| (click to enlarge) |
In the variations above, I am most interested in the non-IVR filtered strategy variations because I prefer to enter these trades monthly. Based on a number of factors, my preferred variation is profit taking at 25%, loss taking at 75% and DTE in the 55 to 70 range. These are the same profit taking and loss taking levels I selected for the SPX. Another set of variations that are interesting are the 50:10 between 59 and 80 DTE...these have win rates in the 90% range. Also note, that 2015 was an unusually good year for both RUT and SPX short straddles....don't expect this higher than normal win rate to continue.
If you want to check out the details behind the numbers shown in the tables above, take a look at my RUT Straddle Summary Page that lists links to all of the articles in the series and associated Tweets.
Follow my blog by email, RSS feed or Twitter (@DTRTrading). All options are available on the top of the right hand navigation column under the headings "Subscribe To RSS Feed", "Follow By Email", and "Twitter".


4 comments:
Insightful as always Dave - well done!
Thanks Kirk...I appreciate your feedback.
superb work Dave
i always impressed by simple managed straddle results here
which one is your favorites, straddle or strangle?
do you manage exit differently on high volatility times like this month?
thanks,
Albert
Hi Albert,
I'm mostly a strangle, iron condor, and iron butterfly trader...in that order. I consistently trade strangles every month, and occasionally enter the other two.
I haven't traded straddles, and only researched them because of some TastyTrade segments. They do look pretty good though...they worked exceptionally well during 2015, which may be why they were so popular last year.
Lately, I've been exiting losing trades slightly earlier than my usual rules due to the market movement.
Thanks,
Dave
Post a Comment