This post reviews the backtest results for 4040 options straddles sold on the RUT at 80 days-to-expiration (DTE). Eight different loss approaches were tested on these straddles. On top of these eight loss approaches, tests were conducted with no profit taking, and profit taking at 10%, 25%, 35%, and 45% of the credit received. You can find the prior RUT straddle summary posts at the links below:
- RUT Straddle - 38 DTE - Results Summary
- RUT Straddle - 45 DTE - Results Summary
- RUT Straddle - 52 DTE - Results Summary
- RUT Straddle - 59 DTE - Results Summary
- RUT Straddle - 66 DTE - Results Summary
- RUT Straddle - 73 DTE - Results Summary
The results for these backtests are summarized in six heat map tables. In these tables, each row corresponds to a different loss exit percentage. For example, the first row (25) corresponds to the strategy variations where losses were taken at 25% of the credit received. These rows have values from 25 to 200. The columns are a little more complicated, and are grouped first by IV rank (IVR) level, and then by profit exit percentage. You can see that each IVR percentage level contains five columns (10, 25, 35, 45, and NA)...with each column representing a profit taking percentage. For example, the first column lists all of the strategy variations where the IVR was less than 25% and profits were taken at 10% of the credit received.
The first table shows the average normalized P&L per day by IVR, profit taking percentage, and loss taking percentage. We see the familiar pattern of the IVR > 50% level outperforming the other IVR levels in terms of P&L per day. The highest daily returns were concentrated in the 45% profit taking level with the IVR > 50%. The top strategy was the (50:45) variation using the IVR > 50% filter...this variation had a P&L of 0.92% per day (on initial PM).
 |
| (click to enlarge) |
The second table shows the average P&L per trade by IVR, profit taking percentage, and loss taking percentage. The IVR > 50% level had the highest P&L per trade readings, with the 45% profit taking level having the greatest strength. The top strategies were the (50:45) and (125:45) variations using the IVR > 50% filter...these variations had a P&L of 51% per trade (on initial PM).
 |
| (click to enlarge) |
The third table shows the win percent / win rate by IVR, profit taking percentage, and loss taking percentage. The lower the profit taking percentage, the higher the win rate for a given IVR grouping...this has been a consistent pattern for both the SPX and RUT, and across DTE. The highest win rates occur with profit taking at 10%. This 10% level had the highest win rates with the IVR < 25% group, with many values of 96%. One point to note, the non-IVR filtered group, with profit taking at 10%, had many win rates of 90% or more with DTE at 45 or greater. For example, the non filtered (50:10) variation had readings of 90% (45 DTE), 89% (52 DTE), 91% (59 DTE), 88% (66 DTE), 95% (73 DTE), and 91% (80 DTE)...very solid win rates with low risk and low profit taking.
 |
| (click to enlarge) |
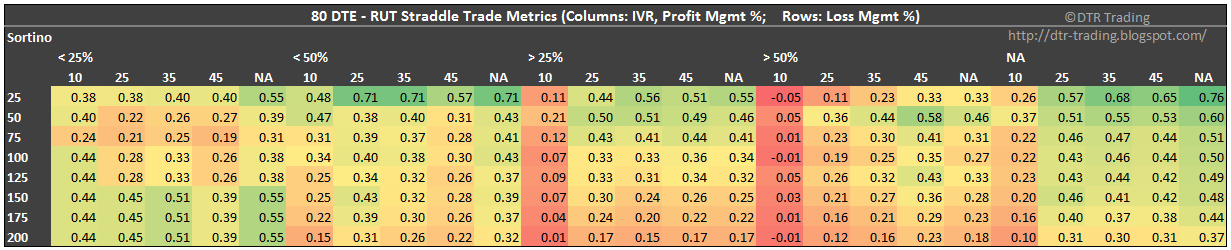
In the fourth table, we see the Sortino Ratio by IVR, profit taking percentage, and loss taking percentage. The Sortinos at 80 DTE show strength at the 25% and 50% loss taking levels. The region of greatest strength is the non-IVR filtered group. The largest value was 0.76 for the non-IVR filtered (25:NA) variation...closed at a loss of 25% of the credit received or carried to expiration. This variation had a win rate of 56% and a P&L per trade of 24%.
 |
| (click to enlarge) |
The fifth table shows the profit factor by IVR, profit taking percentage, and loss taking percentage. There is a region of strength in the IVR > 50% group. The other area of strength is the IVR < 25% group, with profit taking at 10% and loss taking at 100% or greater. The largest value was 4.4 for the (100:10), (125:10), (150:10), (175:10), and (200:10) variations in the IVR < 25% group. These variations had win rates of 96% and P&L per trade values of 12%.
 |
| (click to enlarge) |
The last table shows the average days-in-trade (DIT) by IVR, profit taking percentage, and loss taking percentage. Quicker profit taking, translates into shorter time in the trade.
 |
| (click to enlarge) |
Which variation of the 80 DTE RUT straddle is best? If I was going to sell an 80 DTE ATM RUT straddle every month, I would go with the non-IVR filtered variation, taking profits at 25%, with a loss threshold of 50%. This would put the lower bounds of my gains at 50% of my losses (25/50). The win rate should be approximately 82%, profit factor at 2.3, and an average P&L per trade of 19%.
Based on all of my SPX and RUT straddle backteests, an IVR of greater than 50% occurs during only about 20% of all possible monthly trade entries. When this occurs at a 80 DTE trade entry, I would increase my trade size, but still trade the (50:25) variation. During these periods of increased IVR, many of my trade metrics would improve.
You can find links to all of my RUT straddle articles, and RUT straddle tweets on the RUT Straddle Summary Page. In the next one or two posts I will summarize the results of all of the RUT short straddle backtests.
Follow my blog by email, RSS feed or Twitter (@DTRTrading). All options are available on the top of the right hand navigation column under the headings "Subscribe To RSS Feed", "Follow By Email", and "Twitter".
2 comments:
How many days are you typically in the trade? Do you have to overlap entries (double size) to be in all the trades? Are you saying average 19% of credit received or margin? Thanks. great work. keep sharing.
-Andrew
Andrew,
1. DIT depends on both the entry (DTE) and exit (Loss % & Profit % )criteria.
2. As I mention in my FAQ page, the goal of my research is to compare the relative performance of strategies. The goal is not to generate portfolio metrics. With these two points in mind, trades in my backtests can overlap and are always a fixed size.
3. The profit and loss % levels are based on the credit received...so a percentage of the credit. The returns are based on the initial PM requirement for my account at TOS/TD (prior to the increase in September 2015).
Thanks,
Dave
Post a Comment