Also, in case you missed it, my last post covered the results for profit taking at 35%:
SPX Straddle - 38 DTE - Manage Profits at 35%
For background on the setup for the backtests, as well as the nomenclature used in the charts and tables below, please see the introductory article for this series: Option Straddle Series - P&L Exits.
No IV Rank Filter
In this section we will look at the results of entering one trade for every monthly expiration regardless of the implied volatility (IV) rank of the SPX on the date of entry. Entering these trades at 38 DTE and utilizing our loss exits and 45% credit exits (described here), resulted in the equity curves below.
 |
| (click to enlarge) |
The trade metrics for these different exits are shown in the table below. The (100:45) variation stood out with a solid P&L % / day reading, high overall P&L %, and a good win rate.
 |
| (click to enlarge) |
The table below shows the distribution of returns in five-number summary format. Hat-tip to tastytrade.
 |
| (click to enlarge) |
Below are three sets of scatter plots for selling 38 DTE ATM SPX straddles. The first image contains one scatter plot per strategy and shows P&L in percentage terms versus IV rank for the SPX. The IV rank was captured on the day each trade was initiated. At this level of profit taking it is difficult to distinguish the trend of increasing P&L with increasing IV rank. This is primarily due tot he lower win rates with profit taking at 45%.
| (click to enlarge) |
The next image shows P&L in percentage terms versus initial ATM IV. This ATM IV was captured on the day each trade was initiated. Higher IV resulted in higher returns, but the majority of the profitable and unprofitable trades occurred at lower IV...below 30. Again, the lower win rate at the 45% profit taking level makes it a little difficult to see the trend...there are nearly as many losing trades as winning trades.
 |
| (click to enlarge) |
The third image shows P&L in percentage terms versus days-in-trade (DIT). In order to extract 45% of the credit, the trade duration needs to be longer...this is clearly evident with the clustering of profitable trades above 25 DIT. At the higher loss management levels, 125% and greater, most of the losses were realized at expiration.
 |
| (click to enlarge) |
IV Rank > 50% Filter
In this section we will look at the results of entering one trade for every monthly expiration only when the IV rank of the SPX is greater than 50% ( >50% ). Entering these trades at 38 DTE and utilizing our loss exits and 45% credit exits (described here) resulted in the equity curves below.
 |
| (click to enlarge) |
The trade metrics for these different exits are shown in the table below. As we've seen with the earlier articles, there are significantly fewer trades that meet the >50% IVR criteria. The P&L% per day readings are much higher at the lower loss levels (25%, 50%, 75%). We observed this pattern with the 10%, 25%, and 35% profit management also. The win rate is 65% for all variations, except for the 25% loss management level.
 |
| (click to enlarge) |
The table below shows the distribution of returns in five-number summary format.
 |
| (click to enlarge) |
IV Rank < 50% Filter
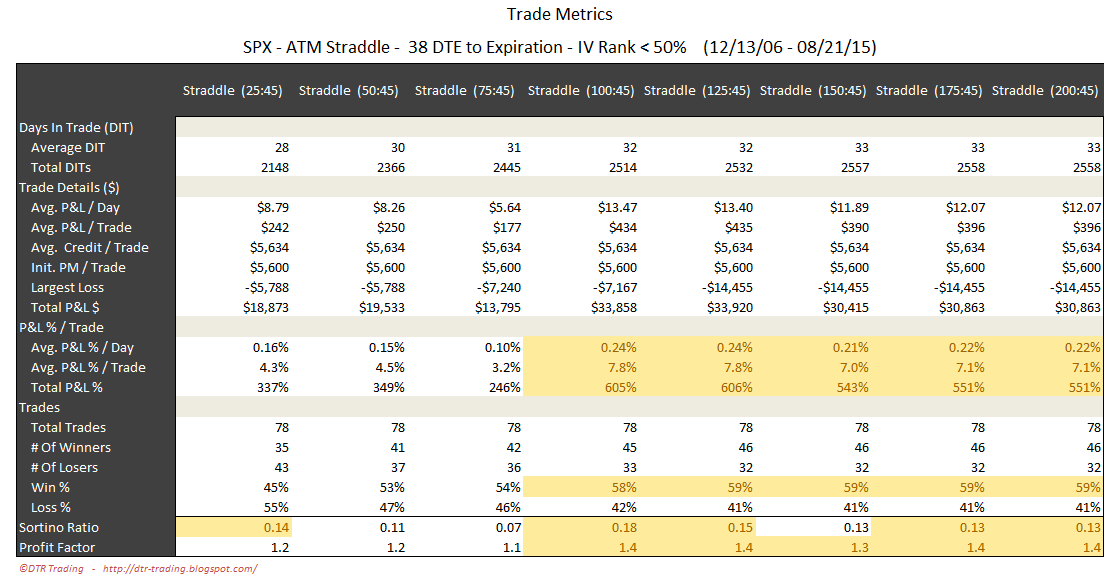
In this section we will look at the results of entering one trade for every monthly expiration only when the IV rank of the SPX is less than 50% ( <50% ). Entering these trades at 38 DTE and utilizing our loss exits and 45% credit exits (described here) resulted in the equity curves below.
 |
| (click to enlarge) |
The trade metrics for these different exits are shown in the table below. Using the lower IVR filter did not improve any of the metrics.
 |
| (click to enlarge) |
The table below shows the distribution of returns in five-number summary format.
 |
| (click to enlarge) |
In the next post I will summarize the backtest results of 38 DTE ATM SPX short straddles, before moving on to the 45 DTE straddle series.
Follow my blog by email, RSS feed or Twitter (@DTRTrading). All options are free, and are available on the top of the right hand navigation column under the headings "Subscribe To RSS Feed", "Follow By Email", and "Twitter". I follow blogs by RSS using Feedly, but any RSS reader will work.
Feel free to use any of the images/information on my blog, but please reference this blog when sharing the information with others.
4 comments:
how about weekly SPX strangles
Dileo,
Not sure if you mean using the weeklies to get more data points for the DTE I've backtested (38, 45, 52, etc), or if you mean shorter term strangles.
Thanks,
Dave
Dave,
Thank you for sharing your comprehensive testing. This is really great stuff!
For the past year I have been trading a small portion of my portfolio in a weekly SPX iron condor position (about 10 delta on sold calls and puts) entered on Friday morning and typically exited the following Monday or Tuesday. I look to make 5-8% and manage losses around 15% of the credit.
It’s attractive for the potential rapid and iterative compounding, and it’s occasionally dynamic due to gamma, but it’s not a squirrely to manage as it might seem.
But I’ve been hit and miss on remembering to enter the trade so I don’t have a reliable nor exhaustive track record to share. It would be very interesting to put the strategy through your test suit with variations (iron condors with varying sold strike deltas and profit targets and similar scenarios with strangles).
Post a Comment